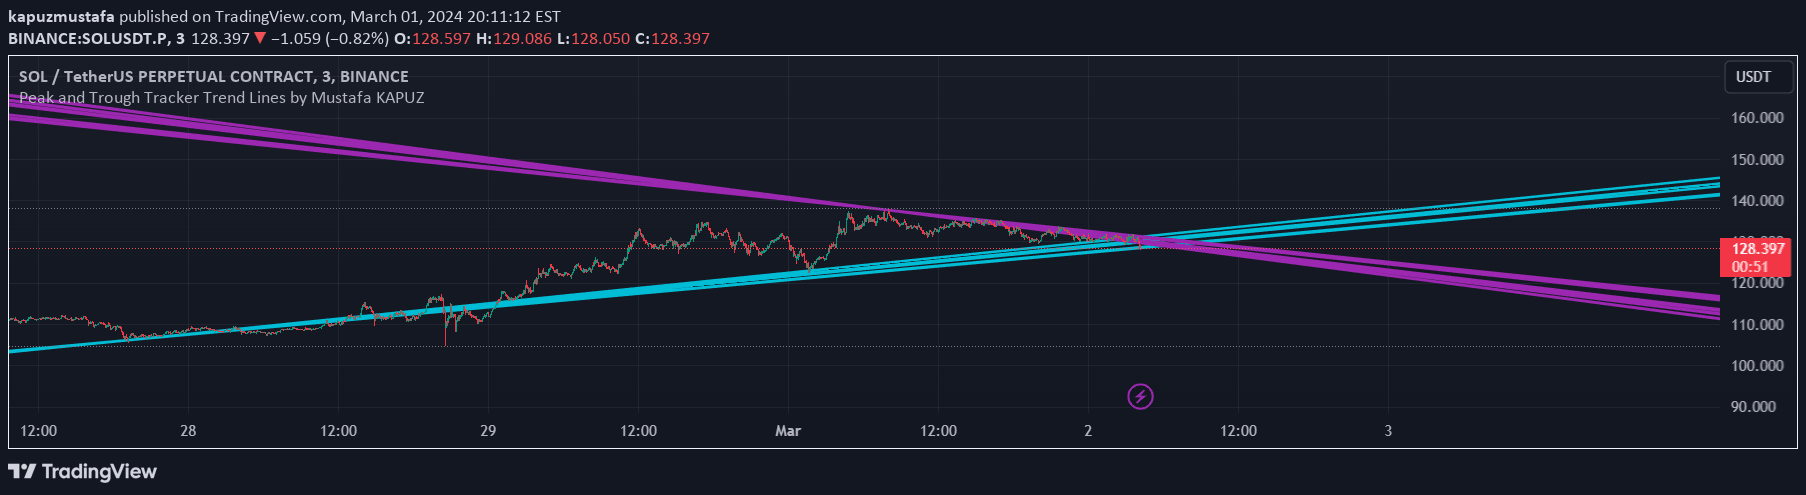
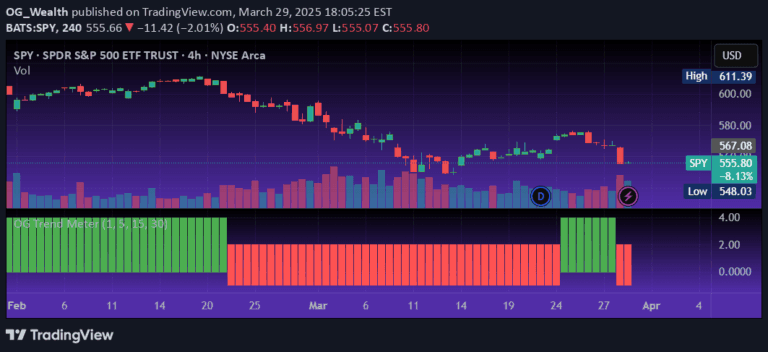
A custom indicator that dynamically draws trend lines using tangent angles, offering unique insights into market momentum and potential price movement based on geometric principles.
Explore complementary indicator rolesHow it works
The indicator first calculates the highest and lowest prices over a user-defined period, establishing critical price reference points. It then determines the angles for trend lines based on the current price, dynamically adjusting to reflect recent market activity.
Trend lines are projected from the highest and lowest points, extending outwards at calculated angles to indicate potential future price movements. By utilizing the tangent of specified angles, the indicator creates a geometric framework that helps traders visualize potential trend continuations or reversals in the market.
Why it may be useful
This indicator provides traders with a unique geometric approach to analyzing market trends, moving beyond traditional linear trend analysis. By incorporating dynamic angle calculations, it offers a more flexible and adaptive method of understanding price momentum and potential directional shifts.
The innovative approach allows traders to gain deeper insights into market behavior, bridging the gap between mathematical precision and technical analysis. It transforms abstract price movements into visually interpretable trend lines, helping traders make more informed decisions about market direction and potential entry or exit points.
When to explore it
The Tangent Angle Trend Lines indicator is most effective in markets with clear directional movements and defined price ranges. It works exceptionally well in analyzing trends across various timeframes, from short-term scalping to longer-term swing trading strategies.
Traders should apply this indicator when seeking to confirm trend strength, identify potential reversal points, and develop more nuanced entry and exit strategies. It is particularly useful in volatile markets where traditional trend analysis might fall short, providing an additional layer of geometric insight to complement existing technical analysis tools.
Keep exploring
What we’ve verified
Access, alerts and repainting behaviour have not been independently verified for this indicator. Check the creator’s current publication and settings.
General descriptions and classifications are recovered research. Verified details above identify the specific checks we have completed. Check the creator’s current publication for later changes.