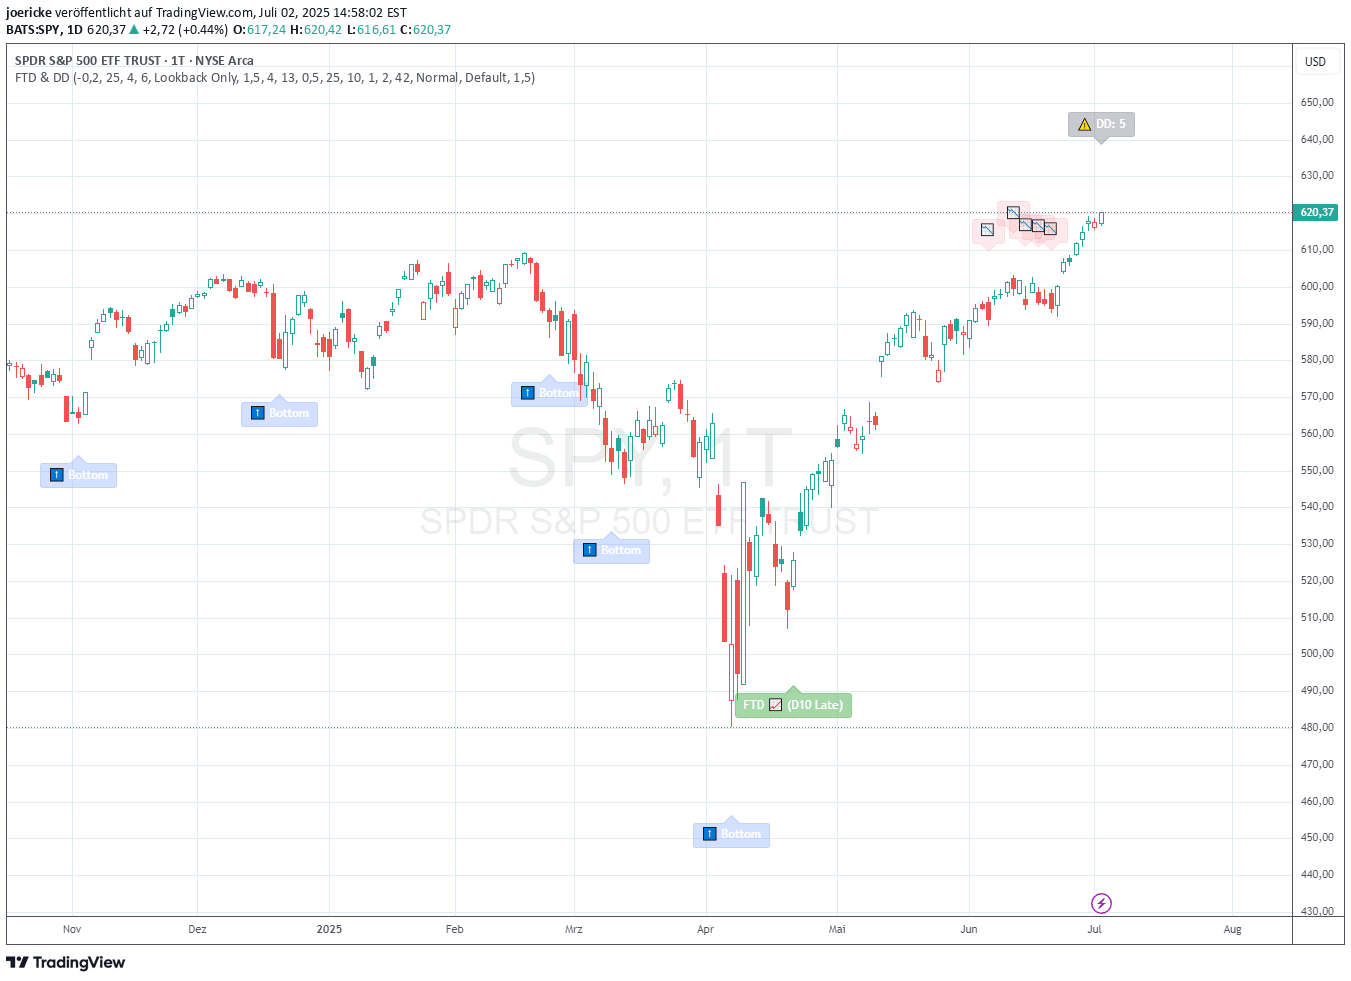
IBD signal tracking market distribution and follow-through days using volume and price change thresholds to identify potential market trend shifts and confirmations.
Explore complementary indicator rolesHow it works
The IBD signal operates by marking specific market days as either distribution or follow-through based on precise volume and price change criteria. For distribution days, the market experiences a price loss of at least 0.2% with higher trading volume compared to the previous day, signaling potential institutional selling and market weakness.
Follow-through days are identified when the market gains at least 1.2% with volume higher than the preceding trading session. These days are crucial for confirming potential trend reversals or the beginning of a new market uptrend, providing traders with a structured method to assess market momentum and sentiment.
Why it may be useful
The IBD signal provides traders with a systematic approach to understanding market dynamics by tracking institutional investor behavior through volume and price movements. By identifying distribution and follow-through days, traders can gain insights into potential trend changes and market sentiment shifts that might not be immediately apparent.
This method helps traders make more informed decisions by offering a structured framework for interpreting market conditions. It allows investors to distinguish between normal market fluctuations and more significant trend developments, potentially reducing emotional trading and providing a more disciplined investment strategy.
When to explore it
The IBD signal is most effective during periods of market transition, such as potential trend reversals or the early stages of a new market cycle. Traders should pay close attention to these signals during volatile market conditions or when there are significant economic or geopolitical events that might impact market direction.
This signal is particularly useful for intermediate to long-term traders who are interested in capturing broader market trends rather than short-term price movements. It works best when used in conjunction with other technical and fundamental analysis tools to provide a comprehensive view of market conditions.
Keep exploring
What we’ve verified
Access, alerts and repainting behaviour have not been independently verified for this indicator. Check the creator’s current publication and settings.
General descriptions and classifications are recovered research. Verified details above identify the specific checks we have completed. Check the creator’s current publication for later changes.