
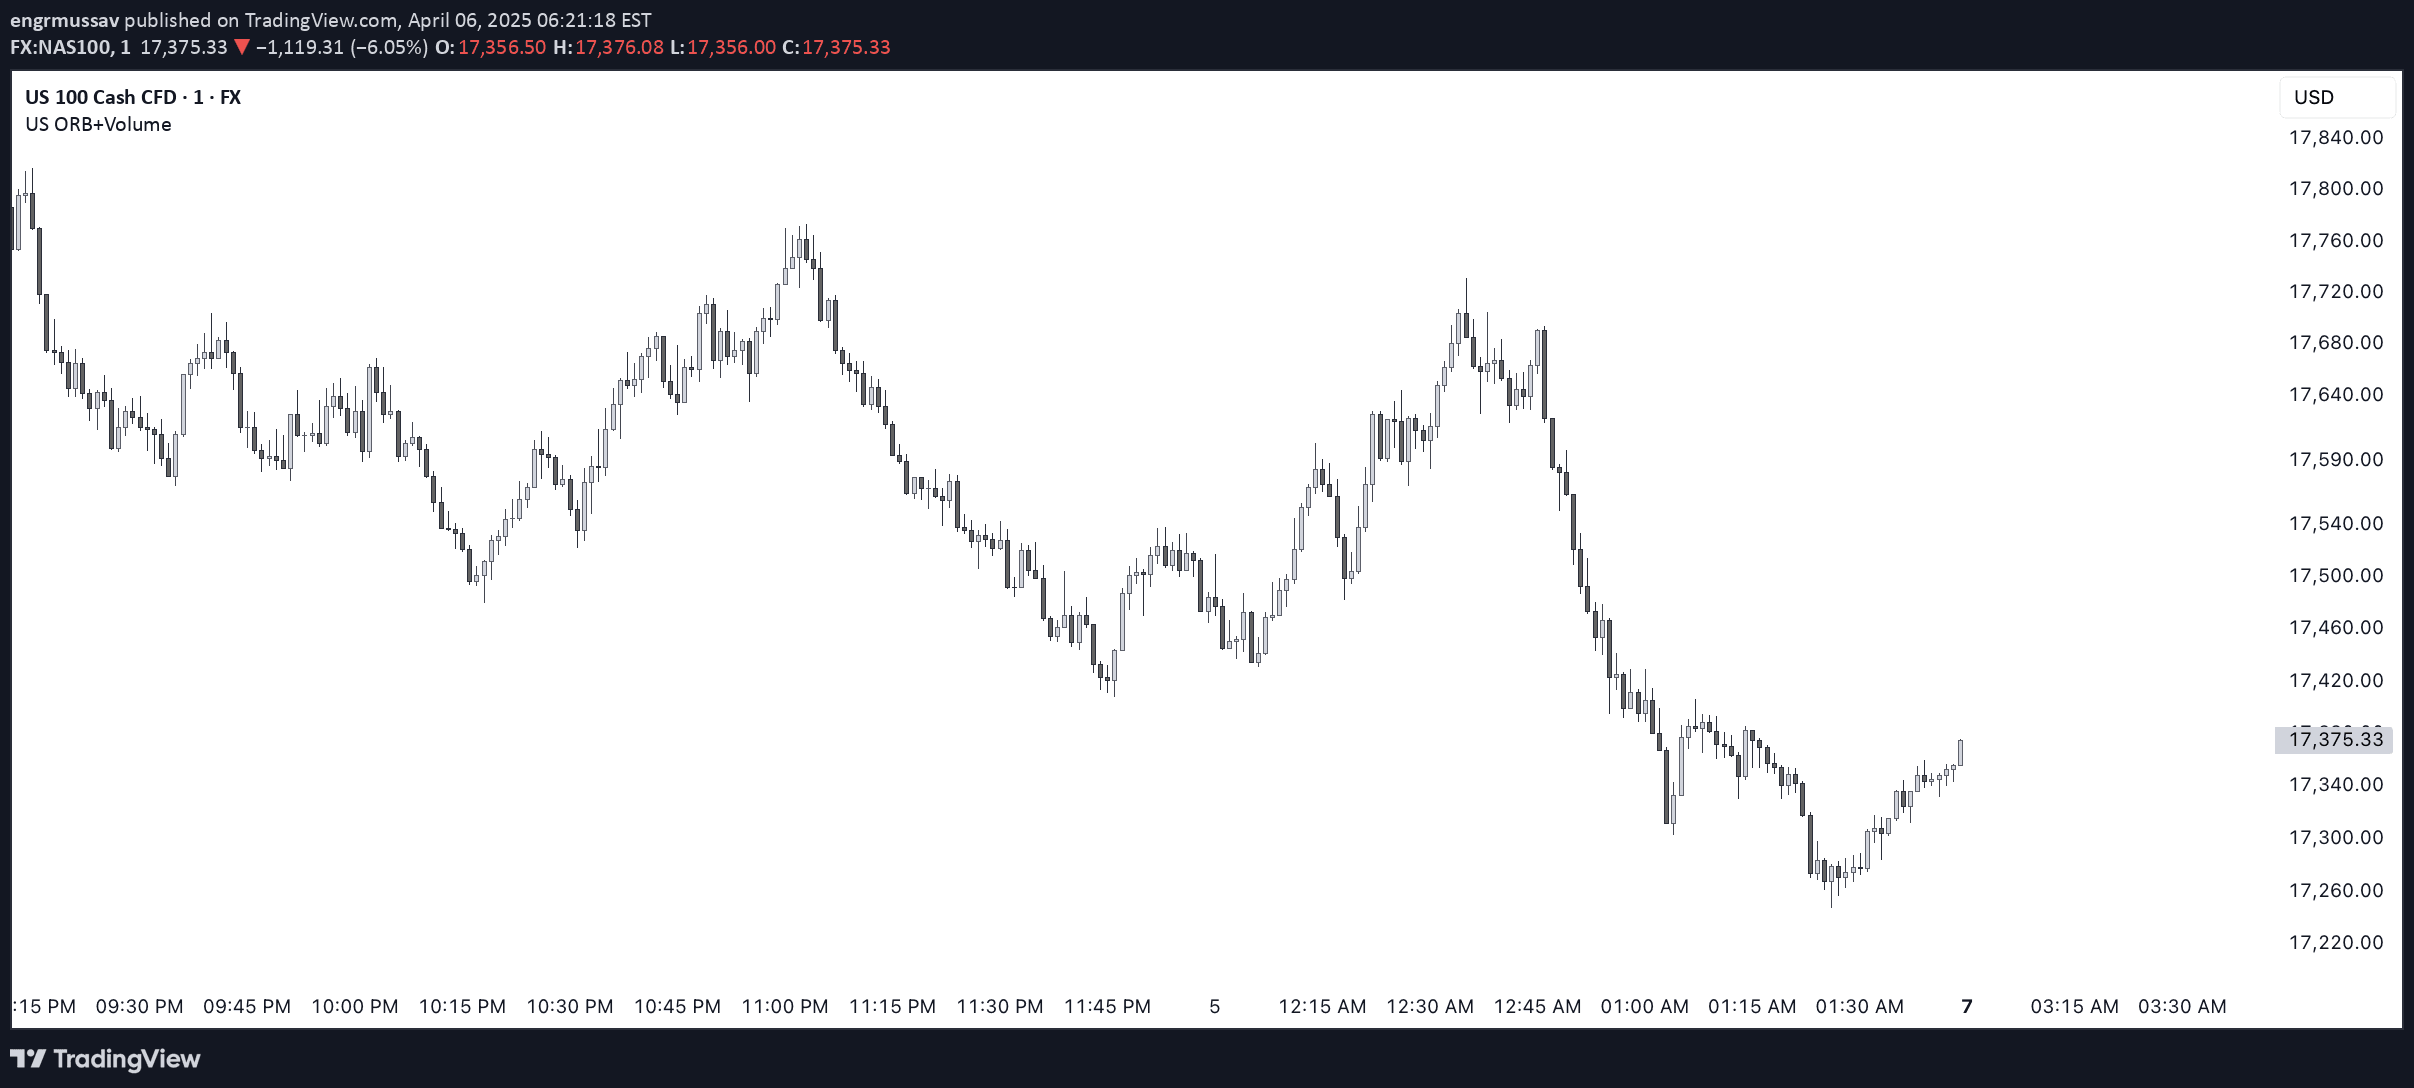
A trading signal focusing on Opening Range Breakout (ORB) strategy for US stocks and ETFs, identifying potential entry points through volume-confirmed breakouts during market hours.
Explore complementary indicator rolesHow it works
The Opening Range Breakout (ORB) signal works by identifying and analyzing the initial trading range of a stock during the market's opening period. Traders first observe the price action and volume during a specific timeframe, typically the first few minutes of trading.
The signal creates a blue background to highlight the formation period, tracking price movements and volume spikes. When the price breaks above or below this initial range with significant volume confirmation, a buy or sell signal is generated. The orange volume highlights help traders validate the strength of the breakout
Why it may be useful
The ORB signal is crucial for traders seeking to capitalize on early market momentum and potential trend reversals. By focusing on the opening range, traders can identify significant price movements before they become widely recognized.
The volume confirmation aspect adds an extra layer of validation, reducing the risk of false breakouts. This strategy helps traders make more informed decisions by providing clear visual cues and objective entry points. It allows for quick identification of potential trading opportunities with a structured, systematic approach
When to explore it
The ORB signal works best during active trading hours on NYSE and NASDAQ markets, particularly for US stocks and ETFs. It is most effective on shorter timeframes, specifically 1-5 minute charts. Traders should use this signal during periods of high market liquidity and volatility, typically within the first hour of market opening.
The strategy is particularly useful for day traders who want to quickly identify and act on potential price movements. Market conditions with clear initial trading ranges and significant volume provide the most reliable signals
Keep exploring
What we’ve verified
Access, alerts and repainting behaviour have not been independently verified for this indicator. Check the creator’s current publication and settings.
General descriptions and classifications are recovered research. Verified details above identify the specific checks we have completed. Check the creator’s current publication for later changes.


