
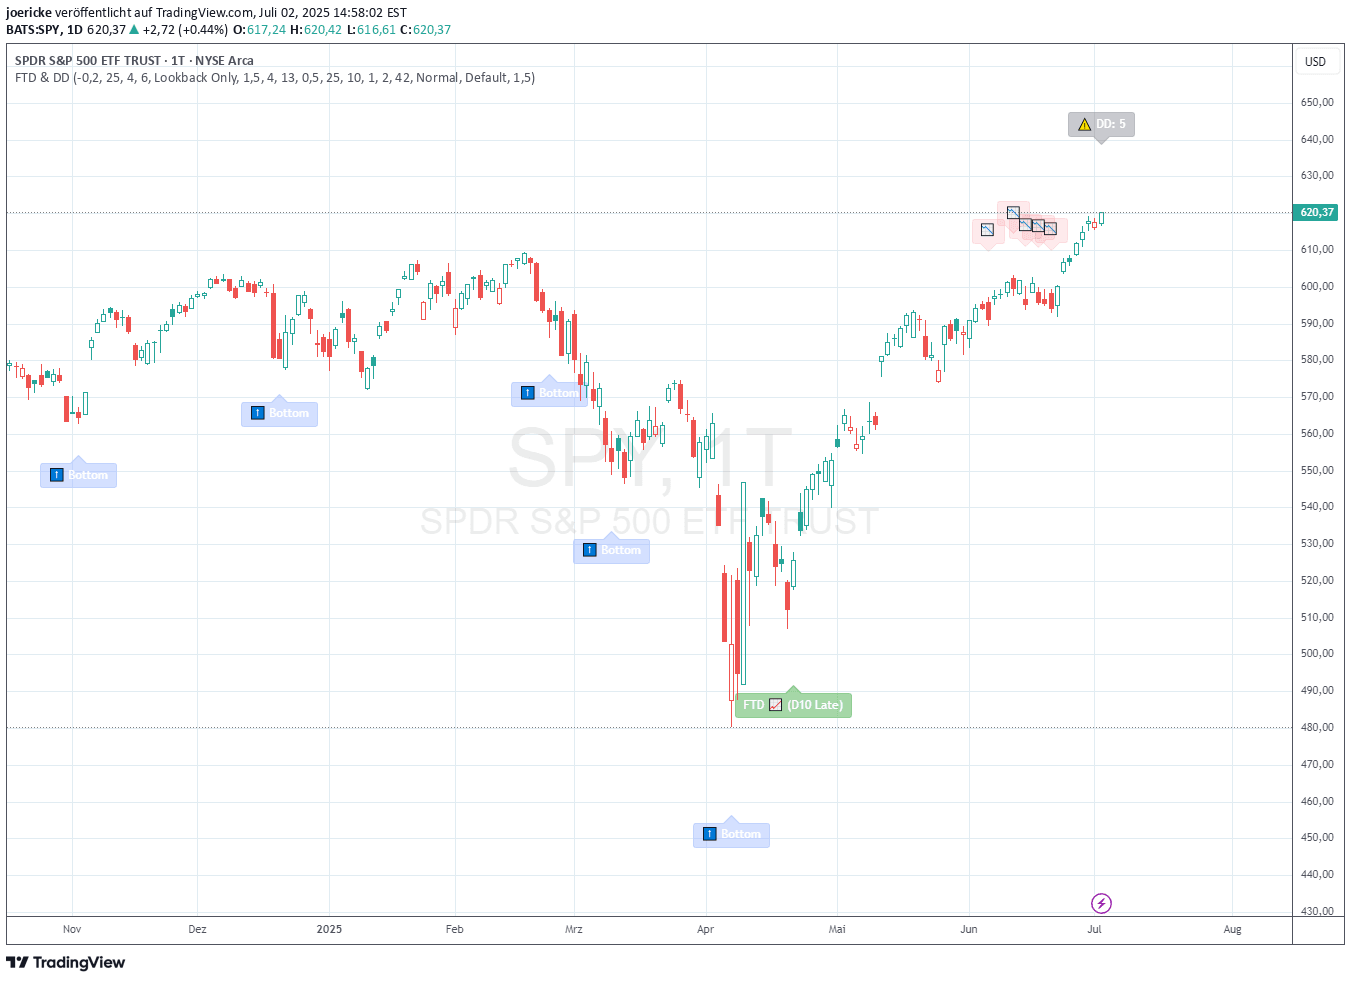
A comprehensive market analysis tool identifying distribution days and follow-through days to detect potential trend changes and market bottoms using William O'Neil's proven methodology.
Explore complementary indicator rolesHow it works
The FTD & DD Analyzer works by tracking two critical market signals: Distribution Days and Follow-Through Days. Distribution Days detect institutional selling pressure by measuring price decline and volume increase, while tracking the accumulation of these days over a specified lookback period. Follow-Through Days identify potential market bottoms by analyzing price gains and volume between days 4-13 after a bottom formation.
The indicator uses sophisticated EMA analysis, monitoring 8 and 21-period exponential moving averages to confirm market bottoms and track momentum. It calculates signals based on predefined criteria such as minimum price decline, volume comparison, and specific timing windows, providing a systematic approach to market trend detection.
Why it may be useful
This signal matters because it provides traders with a data-driven method to understand market sentiment and potential trend reversals based on institutional trading behavior. By tracking distribution days, traders can gauge selling pressure and market weakness, while follow-through days offer insights into potential trend resumptions and market recoveries.
The methodology, developed by William O'Neil through extensive historical market research, offers a proven framework for identifying critical market turning points. It helps traders make more informed decisions by providing context about market health, institutional activity, and potential trend changes beyond simple price movement.
When to explore it
The FTD & DD Analyzer works best during periods of market transition, particularly when looking to identify potential trend reversals or confirmations of new market directions. It is most effective on daily charts and during times of significant market volatility, where institutional trading activity becomes more pronounced.
Traders should use this signal when monitoring broader market conditions, especially after extended downtrends or when seeking confirmation of potential bottom formations. It is particularly useful for swing traders and investors looking to understand underlying market dynamics beyond short-term price fluctuations.
Keep exploring
What we’ve verified
Access, alerts and repainting behaviour have not been independently verified for this indicator. Check the creator’s current publication and settings.
General descriptions and classifications are recovered research. Verified details above identify the specific checks we have completed. Check the creator’s current publication for later changes.





