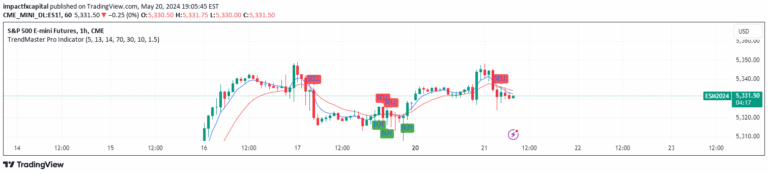
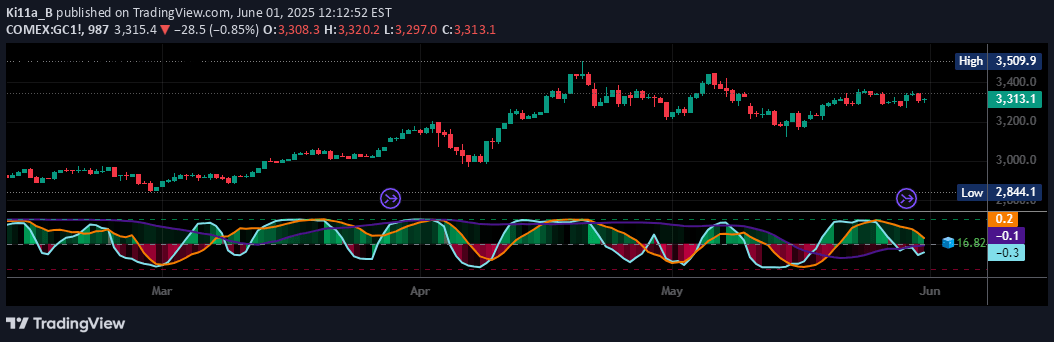
A dynamic market momentum indicator that tracks cumulative 52-week high-low movements across multiple indices, using customizable moving averages to identify trend shifts and market sentiment.
Explore complementary indicator rolesHow it works
The indicator calculates a cumulative sum of 52-week high-low values for selected market indices, creating a comprehensive view of market momentum. It then applies a user-defined moving average (either Simple or Exponential) to smooth the cumulative data and provide a clearer trend analysis.
The script allows traders to choose from multiple indices like S&P 500, Nasdaq Composite, and Russell 2000, offering flexibility in market analysis. By plotting the cumulative index line alongside its moving average, the indicator helps visualize underlying market trends and potential momentum shifts.
Why it may be useful
This momentum indicator provides traders with a sophisticated tool to understand broader market movements and sentiment across different indices. By aggregating 52-week high-low data, it offers insights beyond typical price action, revealing deeper market trends and potential directional shifts.
The dynamic background color feature adds an intuitive visual element, instantly signaling bullish (green) or bearish (red) market conditions. This makes it easier for traders to quickly assess market momentum and make more informed trading decisions based on comprehensive market sentiment.
When to explore it
The indicator is most effective during periods of sustained market trends, where cumulative momentum can provide clear signals about overall market direction. It works particularly well for traders looking to understand broader market sentiment across multiple indices, rather than focusing on individual stock movements.
Traders can leverage this tool during transitional market phases, using its moving average and cumulative line to identify potential trend reversals or confirm existing market momentum. It's especially useful for day and swing traders seeking a comprehensive view of market dynamics across different market segments.
Keep exploring
What we’ve verified
Access, alerts and repainting behaviour have not been independently verified for this indicator. Check the creator’s current publication and settings.
General descriptions and classifications are recovered research. Verified details above identify the specific checks we have completed. Check the creator’s current publication for later changes.