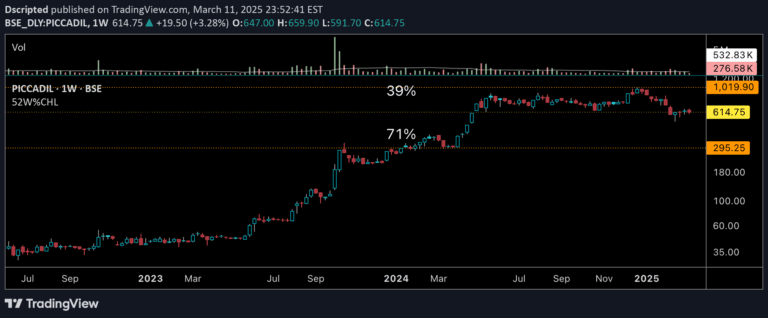
A market breadth indicator tracking cumulative 52-Week New Highs minus New Lows across different market indexes, with a customizable moving average for trend analysis.
Explore complementary indicator rolesHow it works
The 52-Week New Highs and New Lows indicator calculates the difference between stocks reaching new 52-week price highs and those hitting new 52-week lows within a specific market index. By subtracting the number of new lows from new highs, traders can generate a cumulative running total that reflects overall market sentiment and momentum.
The indicator further enhances analysis by applying a moving average to smooth out short-term fluctuations and provide a clearer trend signal. Traders can choose between different market indexes like S&P 500, Nasdaq 100, or the overall market, and customize the moving average length to suit their specific analytical preferences.
Why it may be useful
The 52-Week New Highs and New Lows indicator provides critical insights into market breadth, helping traders understand the underlying strength or weakness of a particular market index. By tracking the cumulative difference between new highs and new lows, investors can gauge whether a broad market trend is gaining or losing momentum.
This indicator serves as a valuable tool for identifying potential market reversals, confirming trend strength, and assessing overall market sentiment. The moving average component adds an additional layer of analysis, helping traders filter out noise and focus on more significant market movements.
When to explore it
This indicator is most effective during periods of significant market transitions, such as potential trend reversals or during extended bullish or bearish market cycles. Traders can use it to confirm the strength of a current market trend and identify potential shifts in market sentiment before they become apparent through price action alone.
It is particularly useful for swing traders and long-term investors who want to understand the broader market dynamics and make more informed investment decisions. By providing a comprehensive view of market breadth across different indexes, this indicator helps traders develop a more nuanced understanding of market conditions.
Keep exploring
What we’ve verified
Access, alerts and repainting behaviour have not been independently verified for this indicator. Check the creator’s current publication and settings.
General descriptions and classifications are recovered research. Verified details above identify the specific checks we have completed. Check the creator’s current publication for later changes.