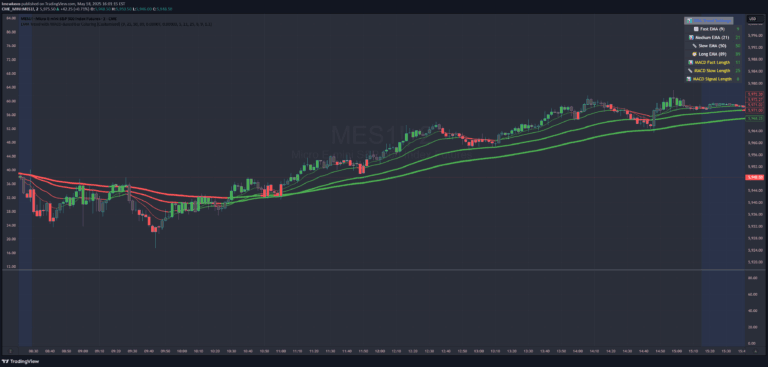
A comprehensive trading indicator combining EMA, MA, OHCL candle patterns, and long wick detection to help traders identify market trends and potential entry/exit points across multiple timeframes.
Explore complementary indicator rolesHow it works
The EMA/MA with OHCL Candle and Long Wick indicator integrates multiple moving averages (5, 9, 15, 20, 50, 100, 200) to analyze market trends and potential reversals. It calculates exponential and simple moving averages across different timeframes, tracking price movement and trend direction.
The indicator simultaneously analyzes candle patterns and long wicks, identifying significant price action signals. By detecting specific wick sizes and OHCL candle configurations, traders can recognize potential market turning points and make more informed trading decisions.
Why it may be useful
This indicator provides traders with a multi-dimensional analysis tool that combines trend identification, price action insights, and signal detection in a single comprehensive view. By integrating multiple technical analysis techniques, it offers a more holistic approach to market evaluation, reducing the complexity of using multiple separate indicators.
The flexibility of customizable wick sizes and timeframes allows traders to adapt the tool to different market conditions and personal trading strategies. Its user-friendly design and lightweight coding make it accessible for traders across various skill levels and trading styles.
When to explore it
The EMA/MA with OHCL Candle and Long Wick indicator is most effective in markets with clear trend movements and significant price action volatility. It works particularly well in liquid markets like forex, stocks, and cryptocurrencies where price patterns and moving averages provide reliable signals.
Traders should use this indicator during periods of market volatility, when price movements are more pronounced and potential trend reversals are more likely. It is especially valuable during key market sessions, economic announcements, and when multiple timeframe analyses suggest potential trading opportunities.
Keep exploring
What we’ve verified
Access, alerts and repainting behaviour have not been independently verified for this indicator. Check the creator’s current publication and settings.
General descriptions and classifications are recovered research. Verified details above identify the specific checks we have completed. Check the creator’s current publication for later changes.