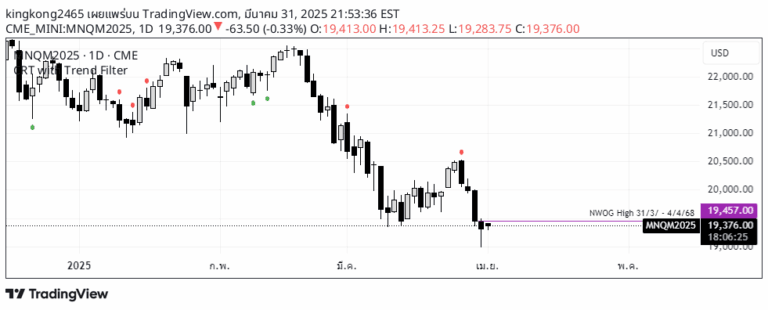
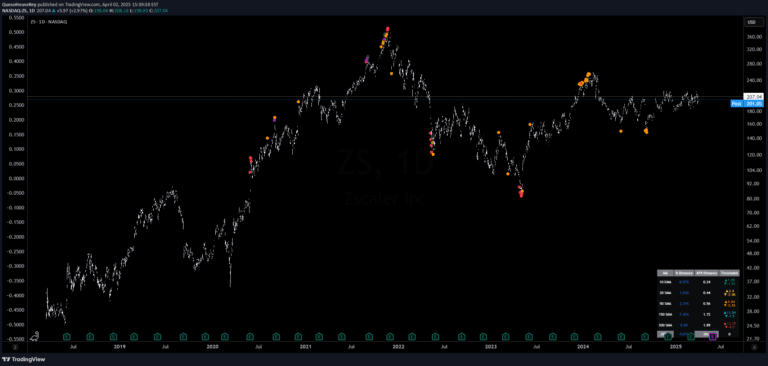
An advanced trading indicator that identifies inside bars and uses moving averages to detect potential breakout and breakdown opportunities in price movement across different market trends.
Explore complementary indicator rolesHow it works
The indicator first identifies inside bars, which are candlesticks completely contained within the previous candle's range, signaling potential market consolidation. These inside bars are then analyzed in conjunction with three Simple Moving Averages (20, 50, and 200 periods) to determine the current market trend.
When the price breaks above the inside bar's high during a bullish trend (price above 50 and 200 SMAs), it generates a breakout signal. Conversely, when the price breaks below the inside bar's low during a bearish trend (price below 50 and 200 SMAs), it generates a breakdown signal, providing traders with clear entry and exit points.
Why it may be useful
This indicator helps traders identify low-volatility consolidation periods that often precede significant price movements, reducing the risk of entering trades during uncertain market conditions. By combining inside bar analysis with moving average trend confirmation, traders can make more informed decisions based on both price action and broader market trends.
The multi-timeframe moving average approach provides a comprehensive view of market momentum, allowing traders to align their trades with the prevailing trend and potentially capture more substantial price movements with increased confidence and precision.
When to explore it
The indicator is most effective in markets with clear trending behavior, where price is consistently moving above or below key moving averages. It works particularly well in liquid markets with sufficient price action, such as major forex pairs, stock indices, and large-cap stocks that exhibit predictable momentum patterns.
Traders should use this indicator during periods of market consolidation, especially when looking to capture breakout moves after extended sideways price action. It is especially useful in identifying potential trend continuation or reversal points across different trading timeframes, from scalping to swing trading strategies.
Keep exploring
What we’ve verified
Access, alerts and repainting behaviour have not been independently verified for this indicator. Check the creator’s current publication and settings.
General descriptions and classifications are recovered research. Verified details above identify the specific checks we have completed. Check the creator’s current publication for later changes.