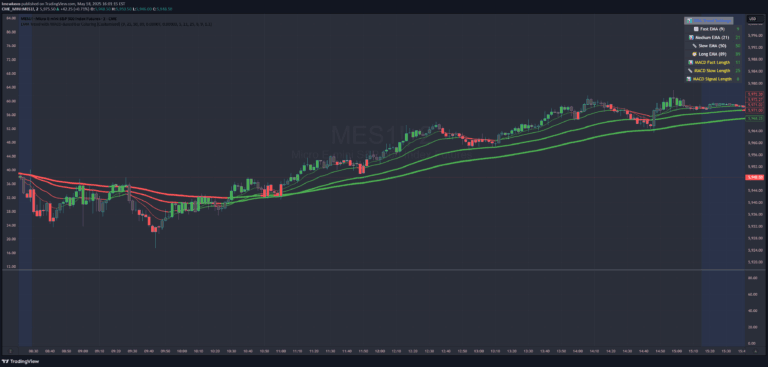
A trend-following strategy using EMA crossovers and RSI confirmation to identify potential buy and sell signals with customizable parameters and multi-stage entry conditions.
Explore complementary indicator rolesHow it works
The strategy begins by identifying trend direction through the interaction of two exponential moving averages (EMA 50 and EMA 200). When the fast EMA crosses the slow EMA, a potential new trend is established. The indicator then waits for a price pullback to the fast EMA, ensuring a more precise entry point.
Simultaneously, the strategy incorporates RSI momentum analysis by monitoring the relationship between RSI and its simple moving average. A buy signal is generated when RSI crosses above its SMA during an uptrend, while a sell signal occurs when RSI crosses below its SMA during a downtrend. This multi-stage confirmation helps filter out weak or false signals.
Why it may be useful
The EMA 50/200 Pullback + RSI strategy provides traders with a systematic approach to trend identification and momentum confirmation. By combining multiple technical indicators, it reduces the likelihood of entering trades based on random price movements and increases the probability of capturing significant market trends.
The strategy's strength lies in its ability to adapt to different market conditions through customizable parameters. Traders can adjust EMA lengths, RSI periods, and distance ranges to suit specific asset characteristics, making it a versatile tool for various trading styles and market environments.
When to explore it
This strategy is most effective in markets with clear, trending characteristics, such as forex, stocks, and cryptocurrencies during periods of sustained directional movement. It performs best in markets with moderate volatility, where price trends can develop and maintain momentum for meaningful periods.
Traders should be cautious during sideways or highly choppy market conditions, as frequent EMA crossovers and RSI fluctuations might generate multiple false signals. The strategy is particularly suitable for day and swing traders who seek structured entry points with multiple confirmation layers.
Keep exploring
What we’ve verified
Access, alerts and repainting behaviour have not been independently verified for this indicator. Check the creator’s current publication and settings.
General descriptions and classifications are recovered research. Verified details above identify the specific checks we have completed. Check the creator’s current publication for later changes.