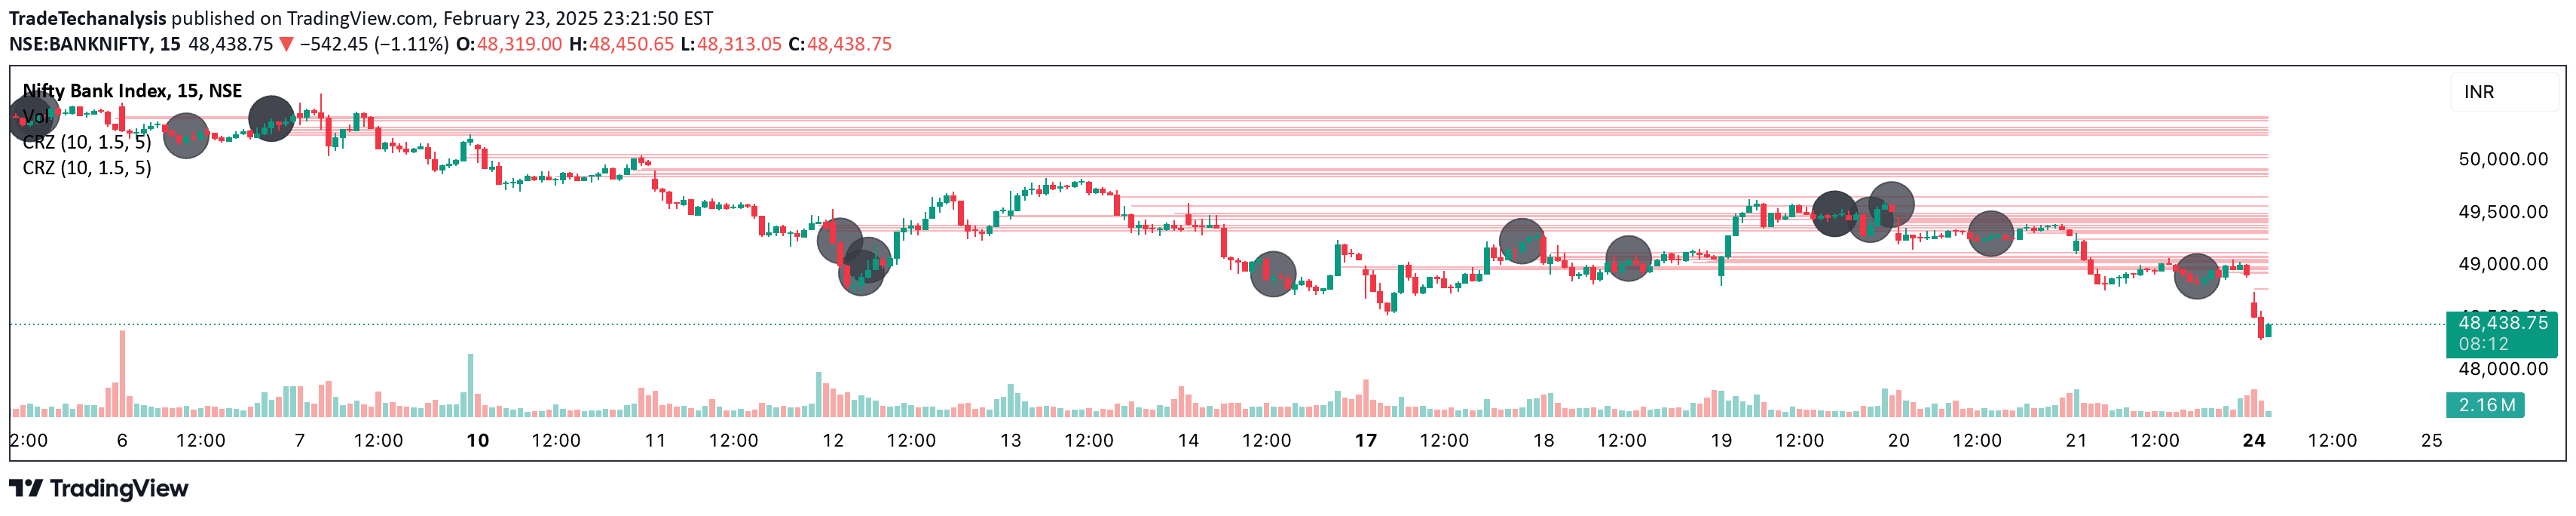
The Swing Failure Pattern (SFP) identifies potential market reversals by detecting price movements that temporarily break key support or resistance levels before quickly returning.
Explore complementary indicator rolesHow it works
The Swing Failure Pattern (SFP) operates by identifying strategic price movements that temporarily breach key support or resistance levels. When price breaks below a support level or above a resistance level and then rapidly reverses, it signals a potential liquidity grab or market manipulation by significant traders.
These patterns are characterized by their quick and decisive reversal, which often triggers stop-loss orders and creates significant market movement. The indicator tracks these precise movements, marking bullish and bearish patterns that represent potential trend reversals or continuation signals.
Why it may be useful
The SFP helps traders identify critical market moments where institutional traders might be creating strategic liquidity traps. By recognizing these patterns, traders can anticipate potential price reversals and understand the underlying market dynamics driven by major market participants.
These patterns provide insights into market psychology, revealing moments when stop-loss hunting occurs and when significant traders might be positioning themselves. Understanding these signals can help traders make more informed decisions about market entry and exit points, potentially improving risk management strategies.
When to explore it
The Swing Failure Pattern works best in markets with clear support and resistance levels and significant trading volume. It is particularly effective in identifying potential reversals in trending markets where price has been moving consistently in one direction.
Traders should use SFP in conjunction with other technical indicators to confirm signals and increase the probability of successful trades. The pattern is most reliable when combined with momentum indicators, volume analysis, and other trend-confirmation tools to validate the potential market movement.
Keep exploring
What we’ve verified
Access, alerts and repainting behaviour have not been independently verified for this indicator. Check the creator’s current publication and settings.
General descriptions and classifications are recovered research. Verified details above identify the specific checks we have completed. Check the creator’s current publication for later changes.