YOUR INDICATOR RESEARCH STARTS HERE

Find the right indicator.
Understand what it does.

Explore 11,183 indicators. Filter beyond the obvious.
Discover the tools that fit the way you trade.

THE INDICATOR LIBRARY

Results for “hightimeframe”

11,183 tools to explore

4 indicators matching your filters
Save search
TrendVolatilityEditor’s pick

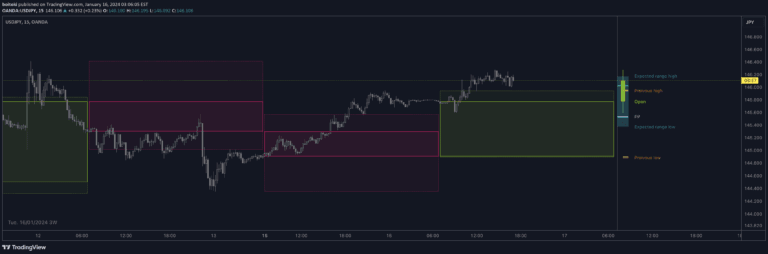
HTF Candles & Pivots

by boitoki

A multi-timeframe candle visualization tool that allows flexible display of historical price data with pivot point calculations and customizable viewing options.

Main price chart · unverifiedDay Trading · Swing Trading
Explore
1.9Klikes82.2Kviews88comments
Save
SignalTrend

Higher Time Frame Strat [QuantVue]

by QuantVue

A trading indicator that visualizes higher timeframe price action using the Strat method, classifying price bars to help traders understand market structure and identify potential trading opportunities.

Main price chart · unverifiedScalping · Day Trading
Explore
307likes5.2Kviews1comments
Save
TrendMomentumSignal

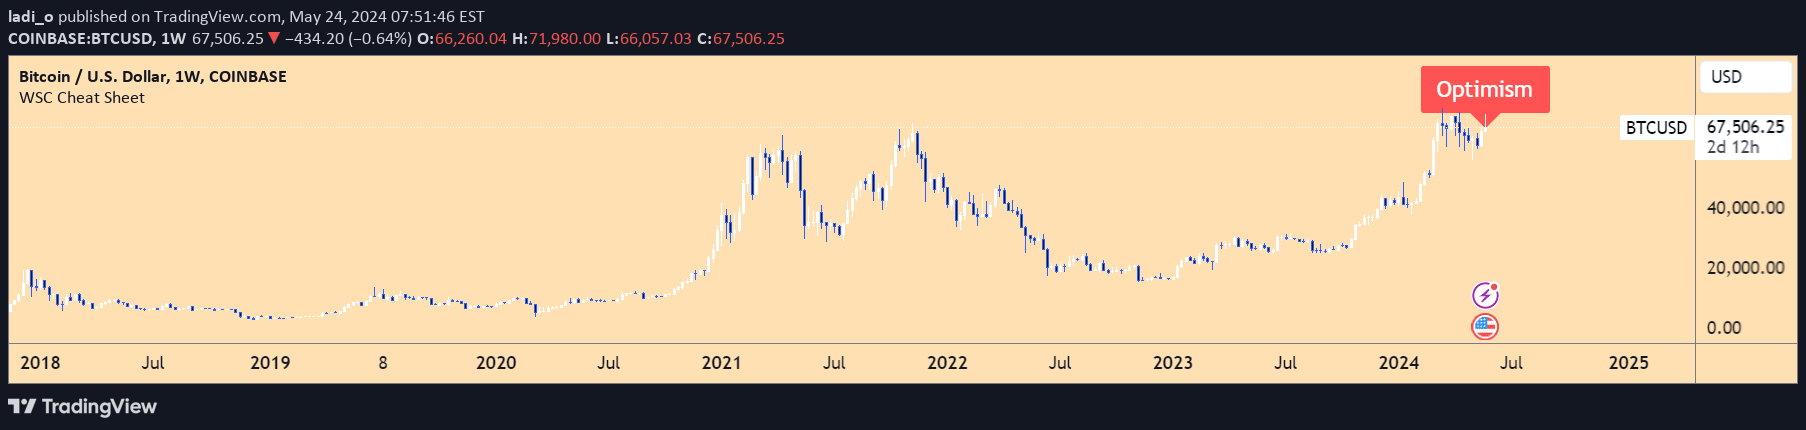
Wall Street Cheat Sheet Indicator

by ladi_o

A dynamic market psychology indicator that uses moving averages and RSI to identify and label different emotional stages of market cycles, helping traders understand market sentiment and potential trend changes.

Main price chart · unverifiedSwing Trading
Explore
55likes2.6Kviews1comments
Save

Likes, views, and comments are historical TradingView snapshots. They describe attention, not trading performance.

START WITH A QUESTION

A little less searching.
A lot more understanding.

Tell DeepAlpha what you need. Get an explanation, a shortlist,
and a direct path to the indicators behind it.

Ask DeepAlpha