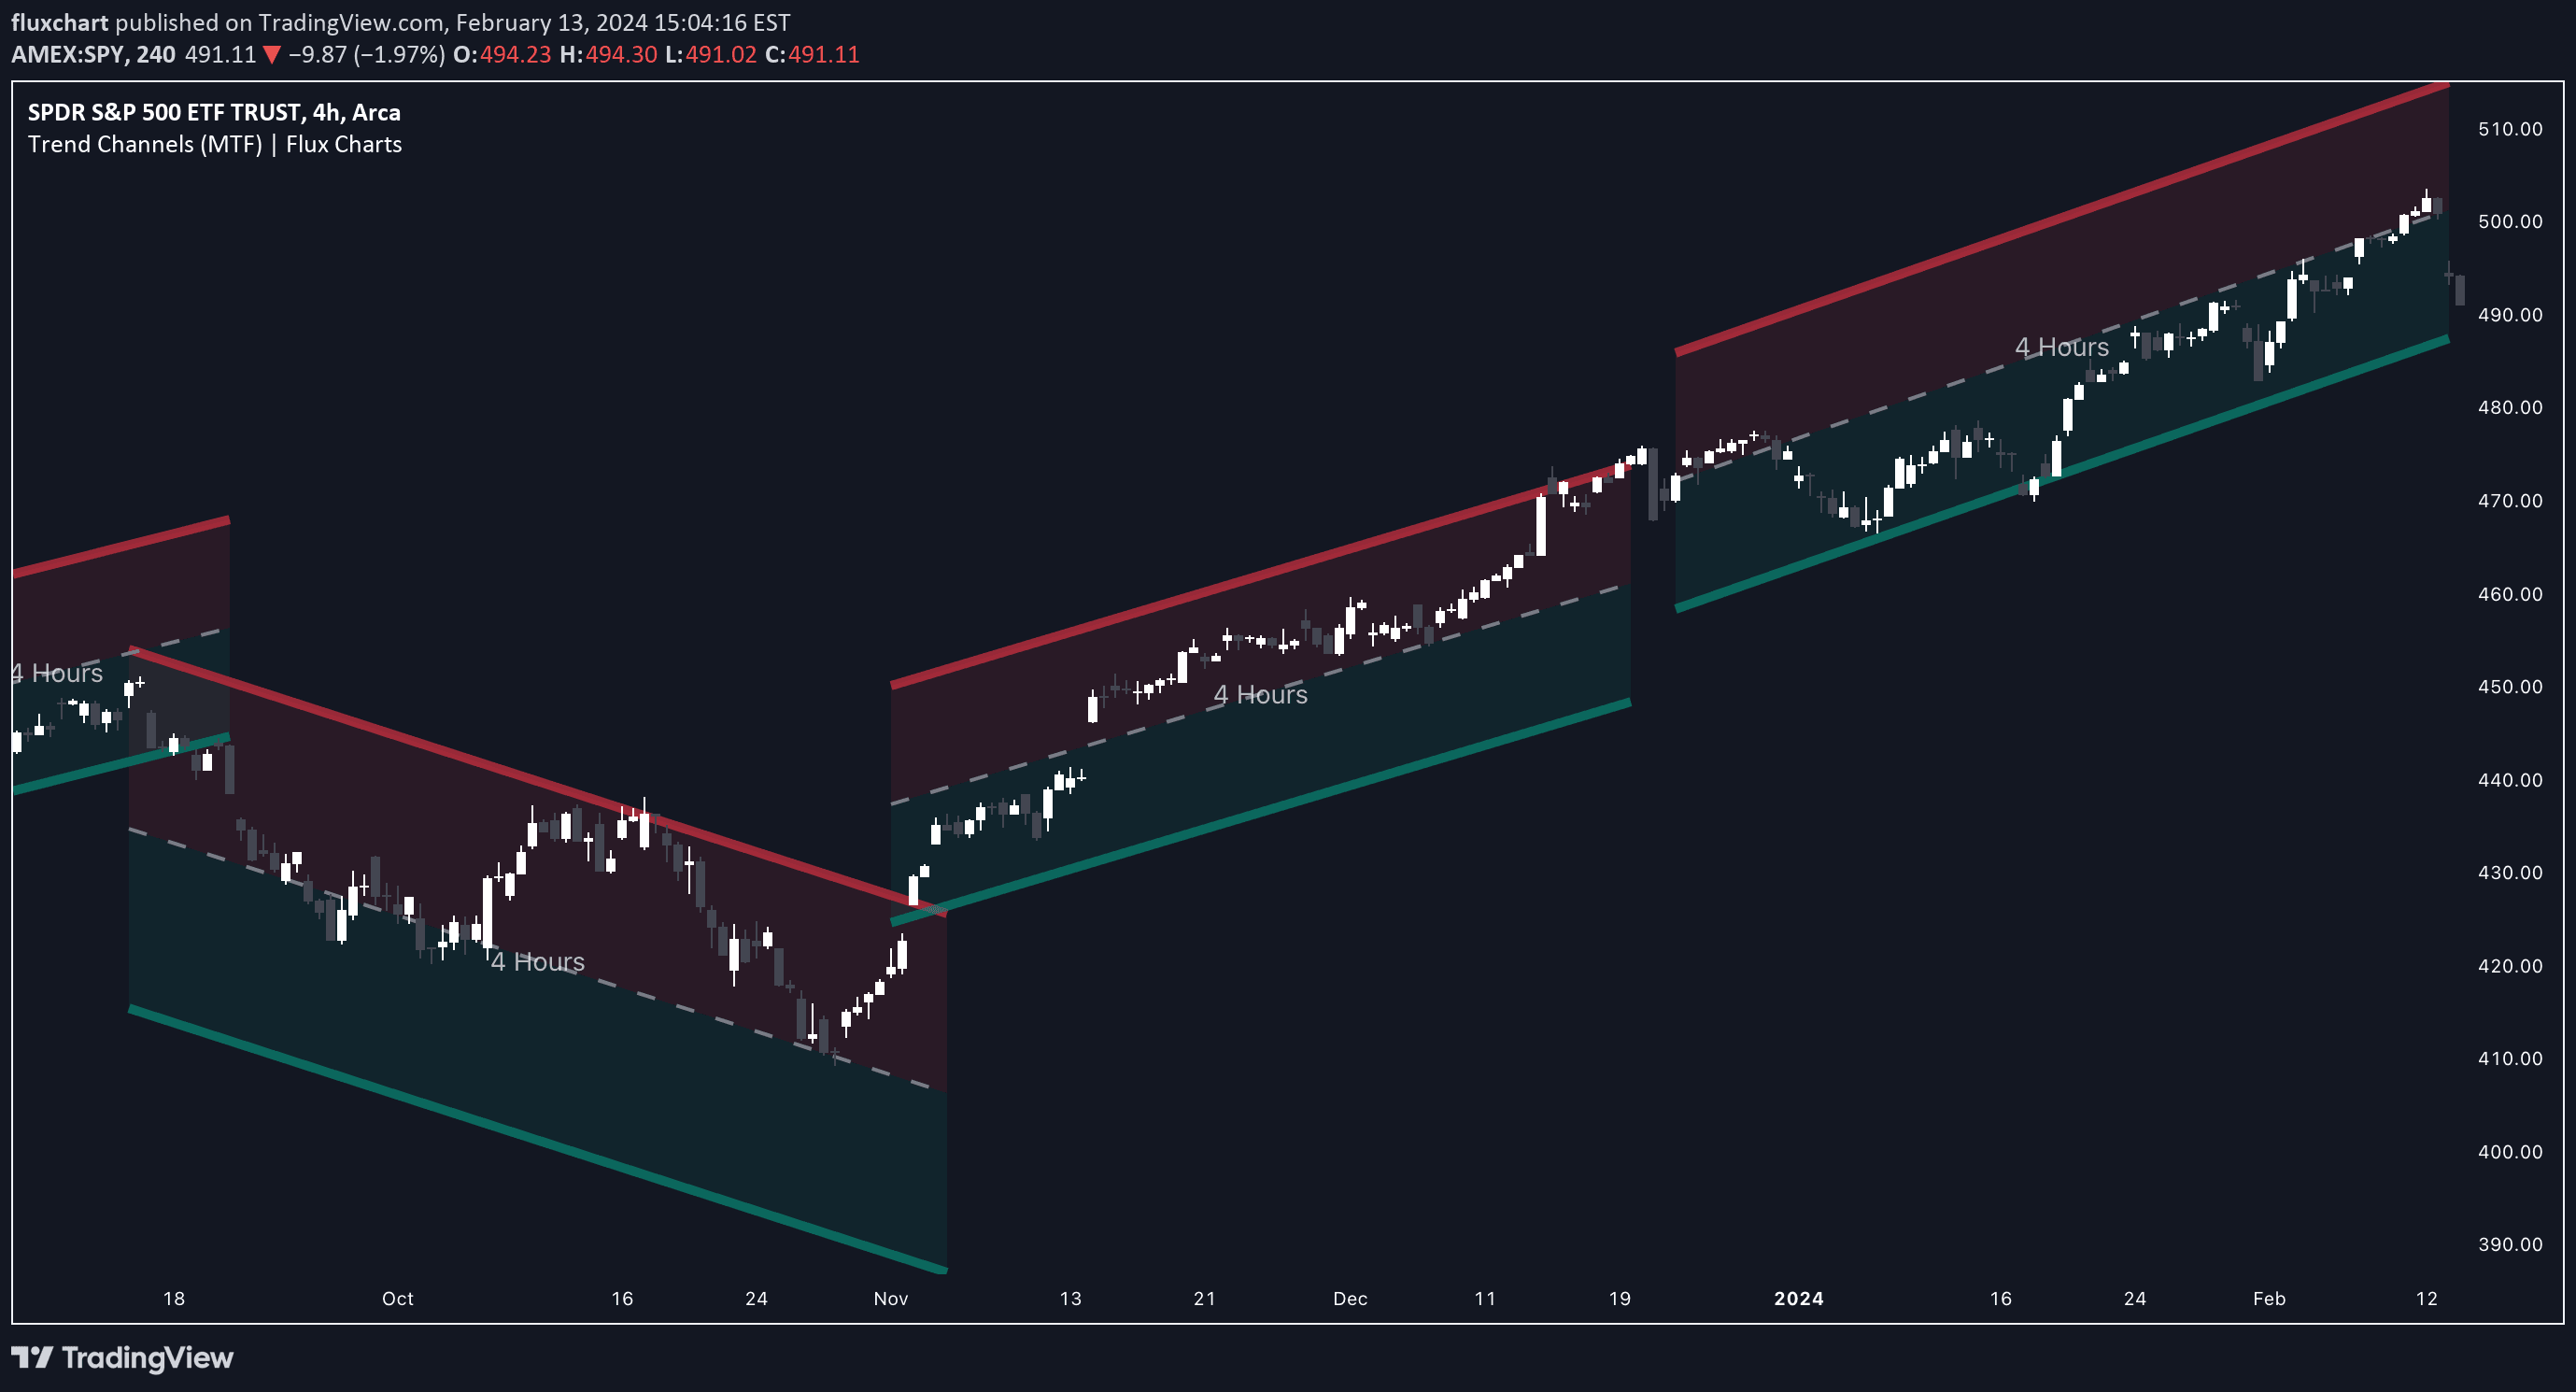
A multi-timeframe SSL Channel indicator that identifies trend direction, support/resistance levels, and potential breakouts by using high and low simple moving averages.
Explore complementary indicator rolesHow it works
The SSL Channel uses high and low simple moving averages to plot a dynamic channel that represents potential trend direction and price movement. When the high and low SMAs cross each other, it signals a potential trend change, with the channel's direction indicating the current market trend.
The indicator incorporates a multi-timeframe approach, allowing traders to analyze price action across different time horizons. By plotting the SSL Channel from a higher timeframe on a lower timeframe chart, traders can gain more comprehensive insights into potential price movements and trend confirmations.
Why it may be useful
The SSL Channel provides traders with a versatile tool for understanding market dynamics by offering clear visual representations of trend direction and potential price reversals. Its multi-timeframe design helps reduce noise and false signals, enabling more accurate trend identification compared to traditional single-timeframe indicators.
By plotting high and low SMAs with an additional midline, the indicator offers multiple reference points for traders to assess market conditions. This comprehensive approach allows traders to make more informed decisions about entry and exit points, supporting more strategic and data-driven trading strategies.
When to explore it
The SSL Channel works best in trending markets where clear directional movements are prevalent, such as during strong bullish or bearish market conditions. Traders can optimize its use by combining it with other confirmation indicators like MACD to enhance signal reliability and reduce potential false breakouts.
The indicator is particularly effective when used on timeframes ranging from 5-minute to 4-hour charts, with a recommended channel length that balances sensitivity and noise reduction. Traders should pay special attention to price interactions with the channel's high and low SMA lines, using these as potential support and resistance levels for making trading decisions.
Keep exploring
What we’ve verified
Access, alerts and repainting behaviour have not been independently verified for this indicator. Check the creator’s current publication and settings.
General descriptions and classifications are recovered research. Verified details above identify the specific checks we have completed. Check the creator’s current publication for later changes.