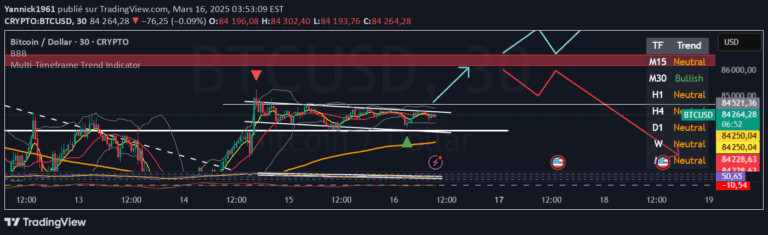
A Volume Spread Analysis indicator that identifies trend direction and volume breakouts by analyzing price, volume changes, and histogram crossovers for potential trading signals.
Explore complementary indicator rolesHow it works
The Volume Spread Analysis indicator combines multiple technical components to generate trading signals by tracking volume, spread, and trend dynamics. It calculates the difference between candle open and close prices and uses EMA 10 to determine spread, which is then multiplied by volume change.
The indicator creates a histogram that tracks volume and trend movement, with signals generated when the histogram crosses its trend moving average line. Trend direction is confirmed through the moving average of the histogram, providing traders with early breakout detection and potential entry points based on volume and price momentum.
Why it may be useful
This indicator offers traders a comprehensive view of market dynamics by integrating volume, price spread, and trend information into a single analytical tool. By detecting early volume breakouts and trend changes, it helps traders make more informed decisions about potential market movements.
The unique approach of combining multiple technical factors reduces the likelihood of false entries and provides a more nuanced understanding of market behavior. Traders can leverage this indicator to identify potential trading opportunities with greater precision and confidence.
When to explore it
The Volume Spread Analysis indicator is most effective in markets with clear trending characteristics and significant volume fluctuations. It performs best in liquid markets where volume changes can provide meaningful insights into potential price movements.
Traders should consider using this indicator during periods of market volatility, such as during major economic announcements or when trading instruments with consistent volume patterns. Adjusting the timeframe can help eliminate fake entries and improve the signal's reliability across different market conditions.
Keep exploring
What we’ve verified
Access, alerts and repainting behaviour have not been independently verified for this indicator. Check the creator’s current publication and settings.
General descriptions and classifications are recovered research. Verified details above identify the specific checks we have completed. Check the creator’s current publication for later changes.