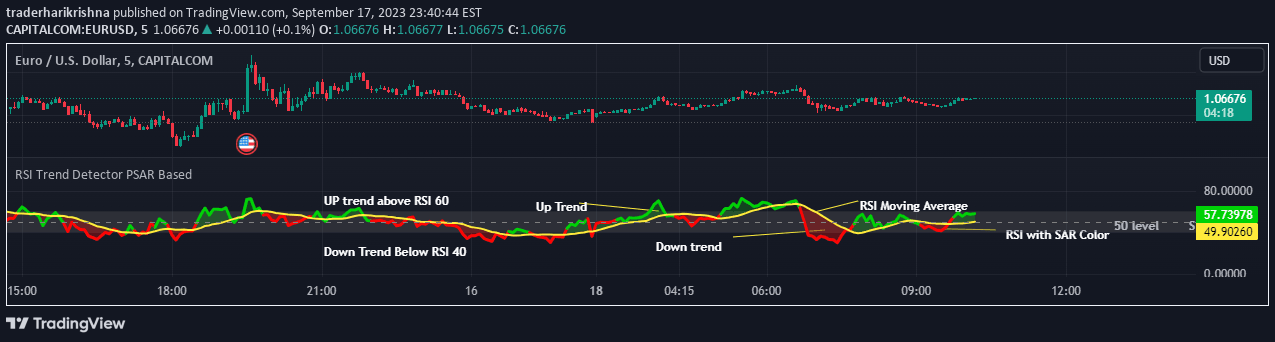
A technical analysis tool using Commodity Channel Index to identify trend reversals and market momentum through an oscillator with smoothing and support/resistance zones.
Explore complementary indicator rolesHow it works
The Trend Tide Oscillator calculates its primary value using the Commodity Channel Index (CCI), which measures the current price level relative to its statistical mean. It applies advanced smoothing techniques to reduce market noise and create a more refined momentum indicator that can track price movements more accurately.
The oscillator then plots support and resistance zones based on the highest and lowest values over a specified lookback period, typically 50 periods. These zones are dynamically adjusted to account for market volatility, providing traders with adaptable levels that can help identify potential trend reversals and market conditions.
Why it may be useful
By combining multiple analytical techniques, the Trend Tide Oscillator offers traders a comprehensive view of market momentum and potential trend changes. Its smoothed CCI approach helps filter out market noise, allowing traders to focus on more significant price movements and reduce false signals.
The indicator's support and resistance zones provide visual cues about potential market turning points, helping traders make more informed decisions about entry and exit strategies. Its customizable parameters also allow traders to adapt the tool to different market conditions and personal trading styles.
When to explore it
The Trend Tide Oscillator is most effective in markets with clear momentum and identifiable trend characteristics, such as forex, stocks, and cryptocurrencies. It performs best in trending markets where price movements are more pronounced and directional, allowing traders to capture significant price swings.
Traders should use this indicator in conjunction with other technical analysis tools to confirm signals and reduce the risk of false positives. It is particularly useful during periods of moderate to high market volatility, where its smoothing techniques can help distinguish between noise and meaningful price movements.
Keep exploring
What we’ve verified
Access, alerts and repainting behaviour have not been independently verified for this indicator. Check the creator’s current publication and settings.
General descriptions and classifications are recovered research. Verified details above identify the specific checks we have completed. Check the creator’s current publication for later changes.