DIY Custom Strategy Builder [ZP] - v1
An advanced all-in-one trading strategy builder that combines over 30 indicators to generate custom buy and sell signals across multiple timeframes and trading styles.
Explore 11,183 indicators. Filter beyond the obvious.
Discover the tools that fit the way you trade.
11,183 tools to explore
An advanced all-in-one trading strategy builder that combines over 30 indicators to generate custom buy and sell signals across multiple timeframes and trading styles.
Volume Delta Candles analyze intrabar trading activity by comparing buy and sell volumes, providing visual insights into price movement and trading sentiment within each candle.
A dynamic trend-following indicator that uses Variable Index Dynamic Average to adapt to market volatility, providing insights into price movements and volume pressure.
An advanced trading indicator implementing the ICT Turtle Soup strategy, which identifies liquidity zones and market structure shifts to generate precise entry and exit signals for traders.
A dynamic trading indicator that identifies potential breakout opportunities by visualizing price ranges and offering customizable risk management through target and stop loss settings.
An advanced Opening Range Breakout (ORB) indicator that analyzes market trends in the first session minutes, providing precise entry, take-profit, and stop-loss signals.
Volume Suite provides multiple volume-based indicators to analyze trading activity, including Volume Delta, CVD, Buy/Sell Volume, and Relative Volume for comprehensive market insights.
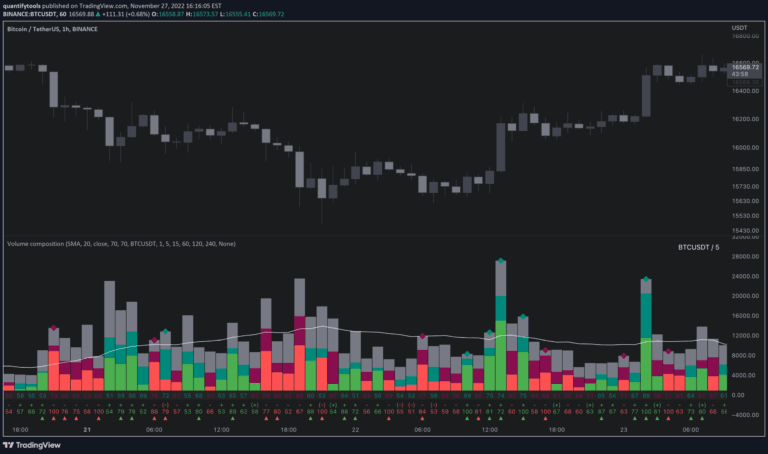
Volume composition indicator that breaks down trading volume into buy, sell, passive, and active components to provide deeper insights into market liquidity and potential price movements.
A dynamic trading indicator that generates buy and sell signals by analyzing price action using customizable depth, deviation, and backstep parameters for precise market entry and exit points.
Volume Delta is an advanced indicator that analyzes trading volumes, revealing buy-sell activities and market momentum through color-coded candlestick visualizations.
A trading calendar indicator that displays daily and monthly market sentiment using three different sentiment calculation methods to help traders quickly assess market direction.
Advanced market structure indicator that analyzes volume delta, detects trend shifts, and provides dynamic trailing stops using pivot points and liquidity sweep detection.
Likes, views, and comments are historical TradingView snapshots. They describe attention, not trading performance.