A dynamic EMA crossover indicator that identifies market trends and sideways zones using two customizable exponential moving averages with color-coded visual signals.
Explore complementary indicator rolesHow it works
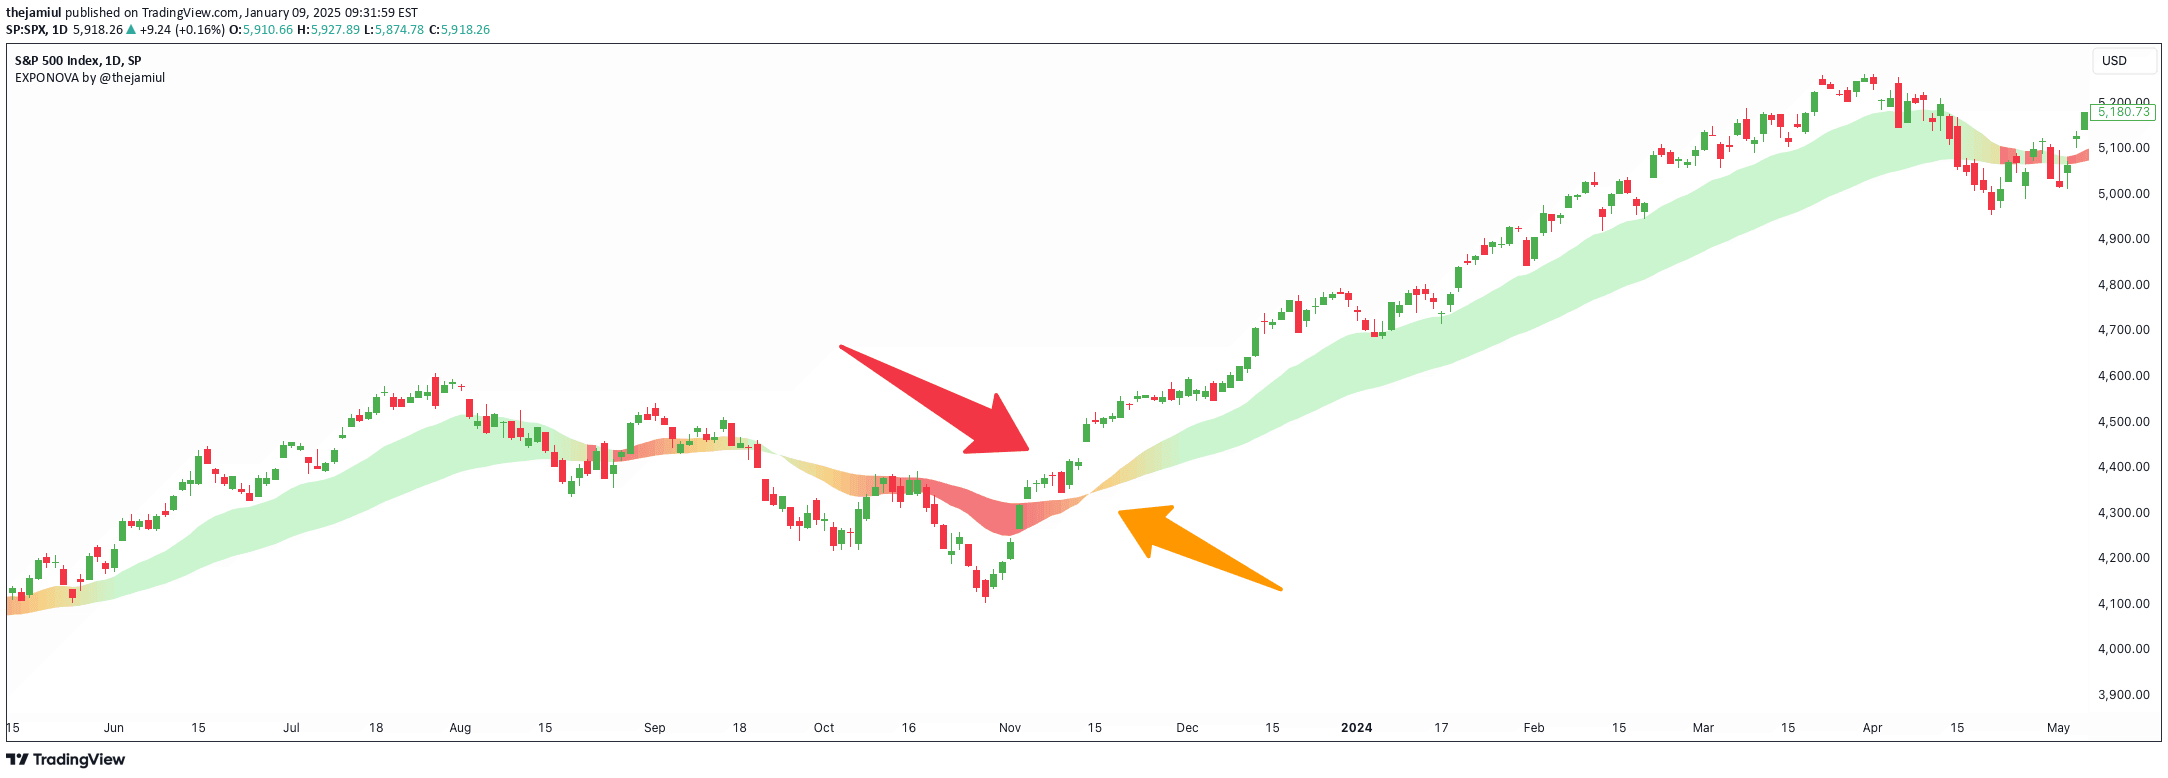
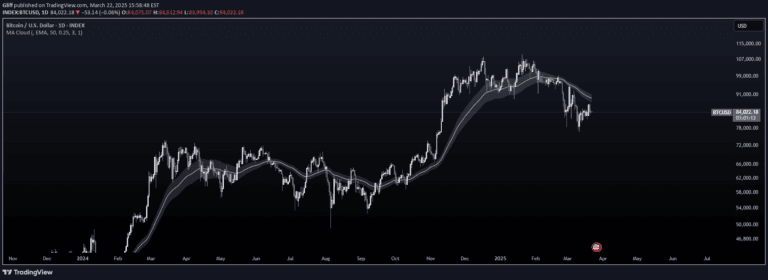
The Dynamic EMA Crossover uses two exponential moving averages (EMAs) to track market trends. When the shorter EMA crosses above the longer EMA, it signals a potential bullish trend, and when it crosses below, it indicates a bearish trend. The indicator dynamically changes colors to visually represent these trend shifts, with green representing bullish conditions and red representing bearish conditions.
Additionally, the indicator employs a sophisticated sideways market detection mechanism. It identifies consolidation zones by monitoring EMA overlap and price movement, highlighting these periods in grey. This helps traders recognize when the market is experiencing low volatility and potential trendless conditions, allowing them to avoid entering trades during uncertain market phases.
Why it may be useful
The Dynamic EMA Crossover simplifies trend identification by providing clear, color-coded visual signals that quickly communicate market direction. By transforming complex moving average calculations into an intuitive display, traders can rapidly assess market conditions without extensive technical analysis. The indicator reduces cognitive load by automatically highlighting trend changes and consolidation zones, enabling traders to make faster and more informed decisions.
Moreover, the customizable nature of the indicator allows traders to adapt it to different market conditions and personal trading styles. By adjusting EMA lengths and overlap sensitivity, traders can fine-tune the indicator to match specific asset characteristics, making it a versatile tool for various trading approaches and timeframes.
When to explore it
The Dynamic EMA Crossover is most effective in markets with clear trending characteristics, such as forex, stocks, and cryptocurrencies. It works best in volatile markets where price movements are distinct and trending conditions are prevalent. Traders should use this indicator when seeking to identify initial trend reversals, confirm existing trends, and avoid entering trades during sideways market conditions.
The indicator is particularly useful for traders who prefer visual confirmation of market trends and want to minimize false signals. It is ideal for scalpers, day traders, and swing traders looking for quick, reliable trend identification. Traders should combine this indicator with other technical analysis tools to validate signals and develop comprehensive trading strategies.
Keep exploring
What we’ve verified
Access, alerts and repainting behaviour have not been independently verified for this indicator. Check the creator’s current publication and settings.
General descriptions and classifications are recovered research. Verified details above identify the specific checks we have completed. Check the creator’s current publication for later changes.