
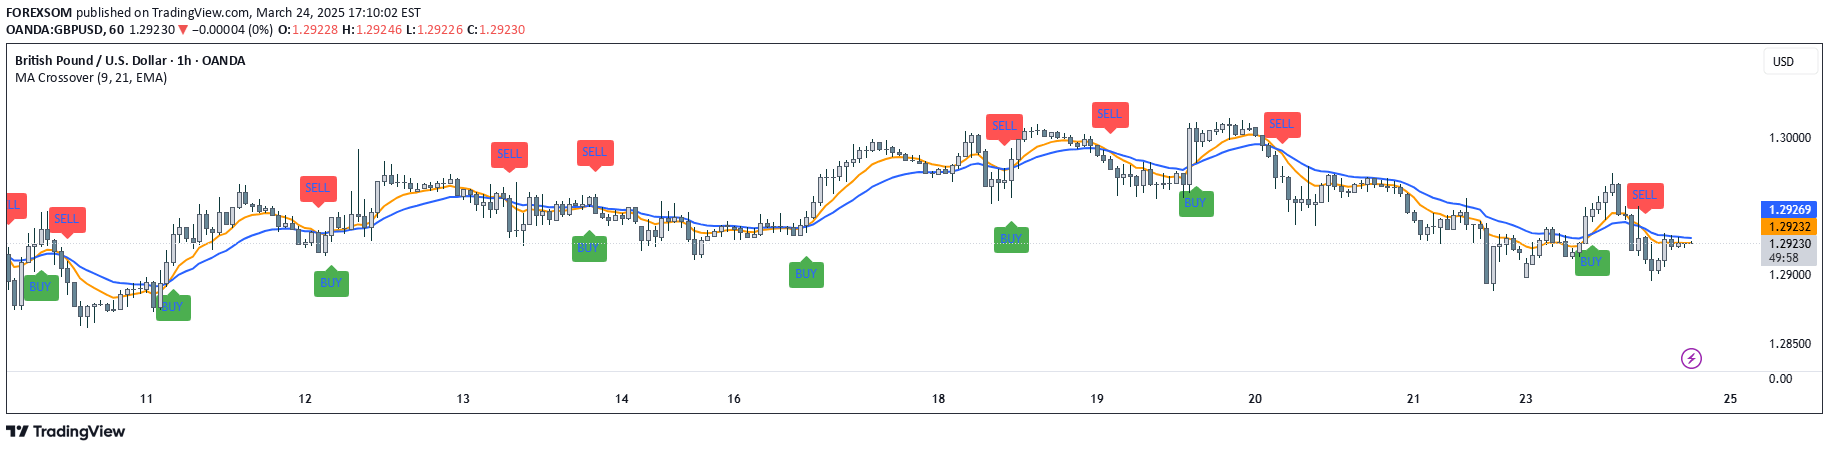
A dual moving average crossover indicator that identifies potential trend reversals by tracking the interaction between fast and slow moving averages.
Explore complementary indicator rolesHow it works
The indicator plots two moving averages on the chart: a fast moving average (default 9-period) and a slow moving average (default 21-period). Traders can customize these moving averages by choosing between Exponential Moving Average (EMA) or Simple Moving Average (SMA).
When the fast moving average crosses above the slow moving average, it generates a bullish signal, suggesting a potential uptrend. Conversely, when the fast moving average crosses below the slow moving average, it creates a bearish signal, indicating a possible downtrend.
Why it may be useful
Moving average crossover strategies help traders identify trend changes and potential entry or exit points in the market. By using two moving averages with different periods, traders can gain insights into momentum and trend direction more effectively than using a single moving average.
The indicator's simplicity makes it accessible to both novice and experienced traders, providing clear visual signals that can be easily interpreted across various financial instruments and timeframes.
When to explore it
This indicator is most effective in trending markets where price is showing consistent directional movement. It works well for traders looking to capture medium-term trend movements and avoid getting trapped in ranging or choppy market conditions.
Traders should use this indicator in conjunction with other technical analysis tools to confirm signals and reduce false positives. It is particularly useful for swing traders and day traders who seek to align their trades with the prevailing market trend.
Keep exploring
What we’ve verified
Access, alerts and repainting behaviour have not been independently verified for this indicator. Check the creator’s current publication and settings.
General descriptions and classifications are recovered research. Verified details above identify the specific checks we have completed. Check the creator’s current publication for later changes.


