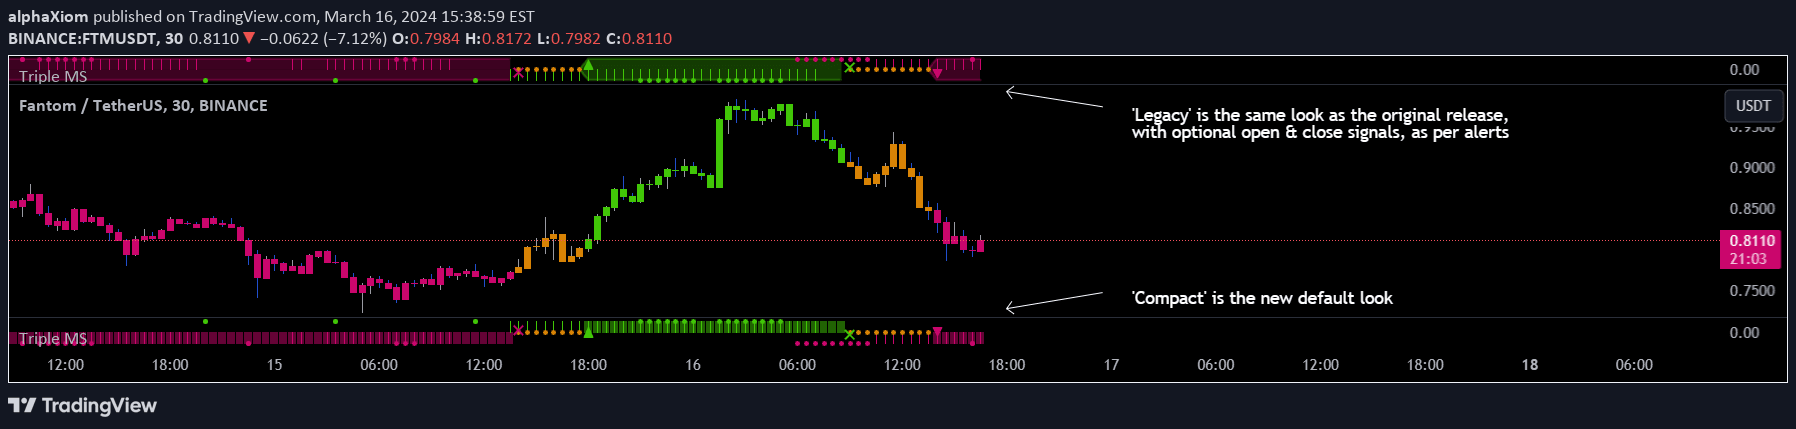
A market condition detector using Average Directional Index (ADX) to classify market trends as bullish, bearish, or sideways, helping traders identify optimal trading environments.
Explore complementary indicator rolesHow it works
The Market Condition Detector analyzes the Average Directional Index (ADX) to determine market trend strength and direction. It calculates the relationship between positive directional index (+DI) and negative directional index (-DI) to classify market conditions.
When the ADX is above a specified threshold, the indicator identifies a strong trend, differentiating between bullish and bearish markets based on the relative positions of +DI and -DI. If the ADX falls below the threshold, it signals a weak or sideways market, suggesting potential consolidation.
Why it may be useful
This indicator provides traders with a clear, objective method of understanding current market dynamics, reducing emotional decision-making and enhancing strategic trading approaches. By quickly identifying trend strength and direction, traders can make more informed choices about potential entry and exit points.
The Market Condition Detector eliminates subjective interpretations of market conditions, offering a systematic approach to trend analysis. It helps traders adapt their strategies to different market environments, whether they are seeking momentum trades or waiting for breakout opportunities.
When to explore it
The Market Condition Detector is most effective when used across multiple timeframes and markets, including crypto, forex, stocks, commodities, and indices. Traders should apply it as a preliminary screening tool to understand overall market sentiment before executing trades.
It works best when combined with other technical indicators like moving averages, RSI, or volume analysis to confirm trading signals. The indicator is particularly valuable for trend traders, swing traders, and breakout traders looking to optimize their entry and exit strategies.
Keep exploring
What we’ve verified
Access, alerts and repainting behaviour have not been independently verified for this indicator. Check the creator’s current publication and settings.
General descriptions and classifications are recovered research. Verified details above identify the specific checks we have completed. Check the creator’s current publication for later changes.