YOUR INDICATOR RESEARCH STARTS HERE

Find the right indicator.
Understand what it does.

Explore 11,183 indicators. Filter beyond the obvious.
Discover the tools that fit the way you trade.

THE INDICATOR LIBRARY

Results for “emassignal”

11,183 tools to explore

7 indicators matching your filters
Save search
MomentumSignalTrend

REMA CROSSOVER BY JUGNU

by whoismudasar

A trading signal that uses RSI, EMA crossovers, and triangular indicators to generate long and short alerts on the daily timeframe for swing trading strategies.

Main price chart · unverifiedSwing Trading
Explore
225likes5.3Kviews1comments
Save
SignalTrend

Dee EMA 5.0

by DeepakGB

Dee_EMA 5.0 is an advanced EMA indicator that displays multiple exponential moving average values across different time frames in a single, easy-to-read table.

Main price chart · unverifiedScalping · Day Trading
Explore
176likes4.2Kviews13comments
Save
TrendSignal

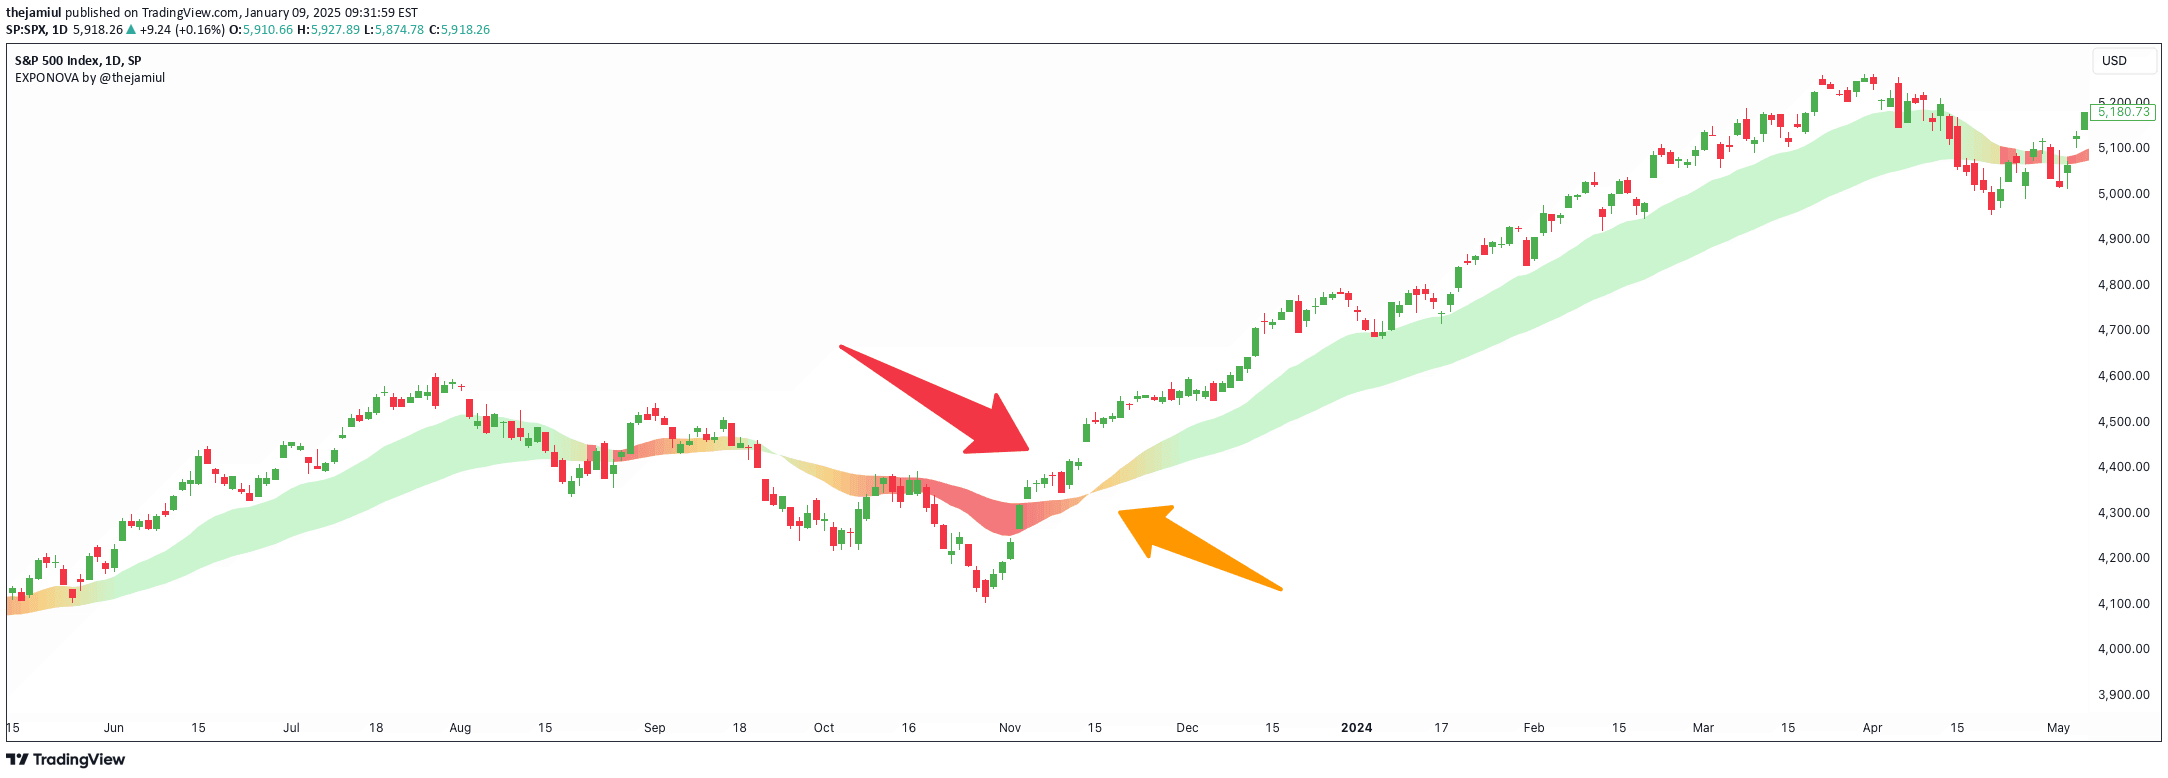
EXPONOVA by @thejamiul

by thejamiul

EXPONOVA is an advanced EMA-based indicator that uses dynamic gradient fills between two moving averages to visually represent market trends, momentum, and potential reversals.

Main price chart · unverifiedScalping · Day Trading
Explore
99likes1.2Kviews2comments
Save
TrendSignal

Dysmen signals

by dysmenorrhoea666

A trading indicator using multiple Exponential Moving Averages to generate buy and sell signals by analyzing short-term and long-term market trends through strategic EMA crossovers.

Main price chart · unverifiedScalping · Day Trading
Explore
90likes2.1Kviews2comments
Save
SignalTrend

Dynamic EMA Crossover

by TradeTechanalysis

A dynamic EMA crossover indicator that identifies market trends and sideways zones using two customizable exponential moving averages with color-coded visual signals.

Main price chart · unverifiedScalping · Day Trading
Explore
35likes752views0comments
Save
Trend

MTF Moving Averages (only EMA)

by Vishy5

A multi-timeframe exponential moving average indicator that plots EMAs across 15-minute, 30-minute, 1-hour, and daily charts to help traders analyze price trends and movements.

Main price chart · unverifiedScalping · Day Trading
Explore
21likes457views0comments
Save
TrendSignal

Smoothed EMA Lines

by FXCapitalClub

A technical analysis tool using smoothed exponential moving averages to help traders identify market trends, support/resistance levels, and potential trading signals across multiple time periods.

Main price chart · unverifiedScalping · Day Trading
Explore
16likes599views3comments
Save

Likes, views, and comments are historical TradingView snapshots. They describe attention, not trading performance.

START WITH A QUESTION

A little less searching.
A lot more understanding.

Tell DeepAlpha what you need. Get an explanation, a shortlist,
and a direct path to the indicators behind it.

Ask DeepAlpha