A trading indicator using multiple Exponential Moving Averages to generate buy and sell signals by analyzing short-term and long-term market trends through strategic EMA crossovers.
Explore complementary indicator rolesHow it works
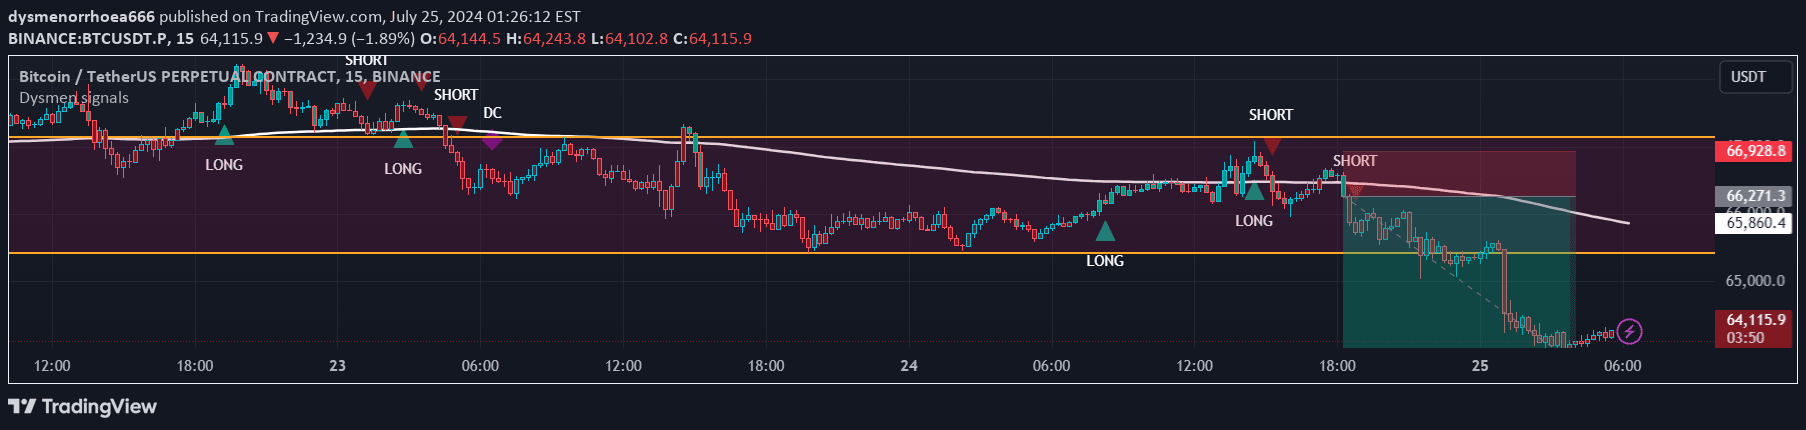
The Dysmen Signals Indicator operates by calculating four different Exponential Moving Averages (EMAs) at 14, 20, 50, and 200 periods. It generates signals by analyzing crossovers between these EMAs, specifically tracking when the short-term EMA 14 crosses the EMA 20 and comparing this movement against the EMA 50 as a trend filter.
The indicator also identifies major trend shifts through Golden Cross and Death Cross events, which occur when the EMA 50 crosses above or below the EMA 200. These crossovers provide traders with clear visual representations of potential market trend changes, marked by distinct signal shapes and colored candles.
Why it may be useful
The Dysmen Signals Indicator helps traders make more informed decisions by providing clear, visually identifiable market trend signals. By combining multiple EMA lengths, it offers a comprehensive view of market momentum, allowing traders to understand both short-term and long-term trend dynamics with greater precision.
The indicator's strength lies in its ability to filter out market noise and provide actionable insights through strategic crossover signals. The color-coded candles and distinct signal markers make it easier for traders to quickly interpret market conditions and potential entry or exit points.
When to explore it
The Dysmen Signals Indicator is most effective in trending markets where clear directional movements are present. It performs exceptionally well in markets with consistent momentum, helping traders identify potential trend reversals and continuation patterns across various timeframes and asset classes.
Traders should use this indicator in conjunction with other technical analysis tools to confirm signals and reduce false positives. It is particularly useful for those seeking a systematic approach to trend identification, providing a structured method for recognizing market shifts and potential trading opportunities.
Keep exploring
What we’ve verified
Access, alerts and repainting behaviour have not been independently verified for this indicator. Check the creator’s current publication and settings.
General descriptions and classifications are recovered research. Verified details above identify the specific checks we have completed. Check the creator’s current publication for later changes.