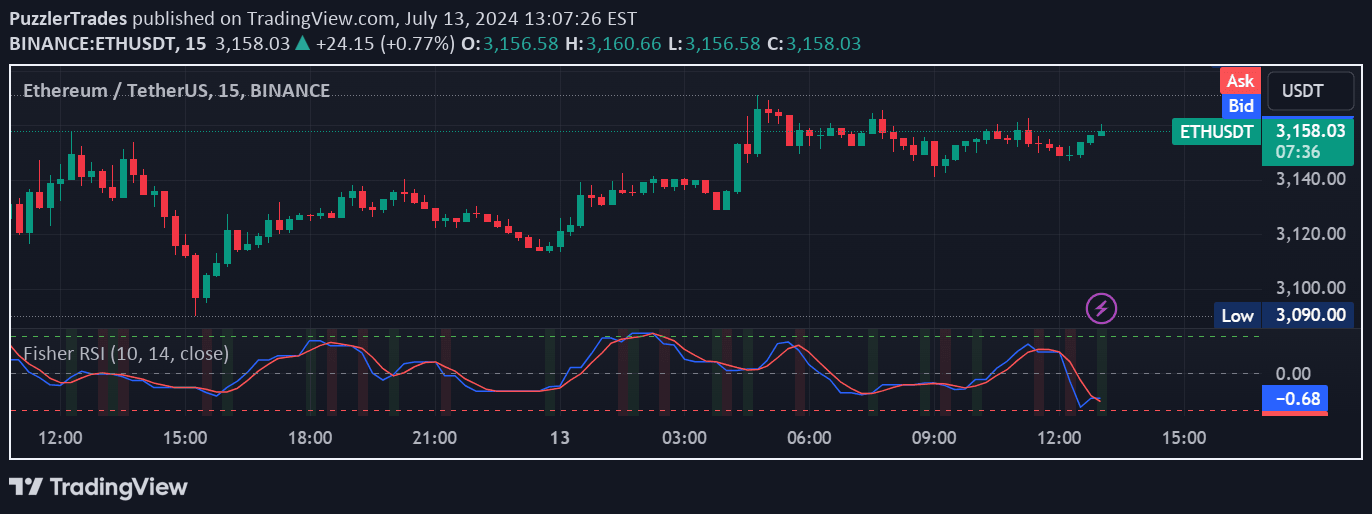
The Fisher Transform on RSI combines Relative Strength Index with Fisher Transform to detect market turning points by converting RSI values into a Gaussian normal distribution, enhancing signal precision.
Explore complementary indicator rolesHow it works
The Fisher Transform on RSI begins by calculating the standard Relative Strength Index using a specified period length and source price. These RSI values are then normalized to fit within a range of -1 to 1, preparing them for the Fisher Transform conversion. The normalized RSI values are processed through the Fisher Transform, which converts them into a Gaussian normal distribution.
This transformation helps smooth out the data and provides a more statistically robust representation of market momentum. A signal line, created by applying a simple moving average to the transformed values, helps identify potential crossover points and trading signals.
Why it may be useful
The Fisher Transform on RSI offers traders a more sophisticated approach to identifying market turning points by converting traditional RSI data into a more precise statistical format. By normalizing and transforming the RSI, traders gain a clearer view of potential overbought and oversold conditions with reduced noise and enhanced signal clarity.
This advanced indicator provides multiple layers of insight, including visual cues through background color changes and built-in alert conditions. Traders can quickly recognize bullish and bearish market sentiments, making it easier to spot potential entry and exit points with greater confidence and statistical reliability.
When to explore it
The Fisher Transform on RSI works best in markets with clear trending characteristics, where momentum shifts can be effectively captured. It is particularly useful in identifying potential trend reversals and providing early signals of changing market dynamics across various timeframes and asset classes.
Traders should utilize this indicator in conjunction with other technical analysis tools to confirm signals and develop comprehensive trading strategies. It is most effective when applied to liquid markets with sufficient price movement, such as major forex pairs, stock indices, and actively traded commodities.
Keep exploring
What we’ve verified
Access, alerts and repainting behaviour have not been independently verified for this indicator. Check the creator’s current publication and settings.
General descriptions and classifications are recovered research. Verified details above identify the specific checks we have completed. Check the creator’s current publication for later changes.