Markov Chain Trend Indicator
A Markov Chain Trend Indicator that analyzes stock price movements by calculating probabilities of transitioning between market states to predict potential future trends.
Explore 11,183 indicators. Filter beyond the obvious.
Discover the tools that fit the way you trade.
11,183 tools to explore
A Markov Chain Trend Indicator that analyzes stock price movements by calculating probabilities of transitioning between market states to predict potential future trends.
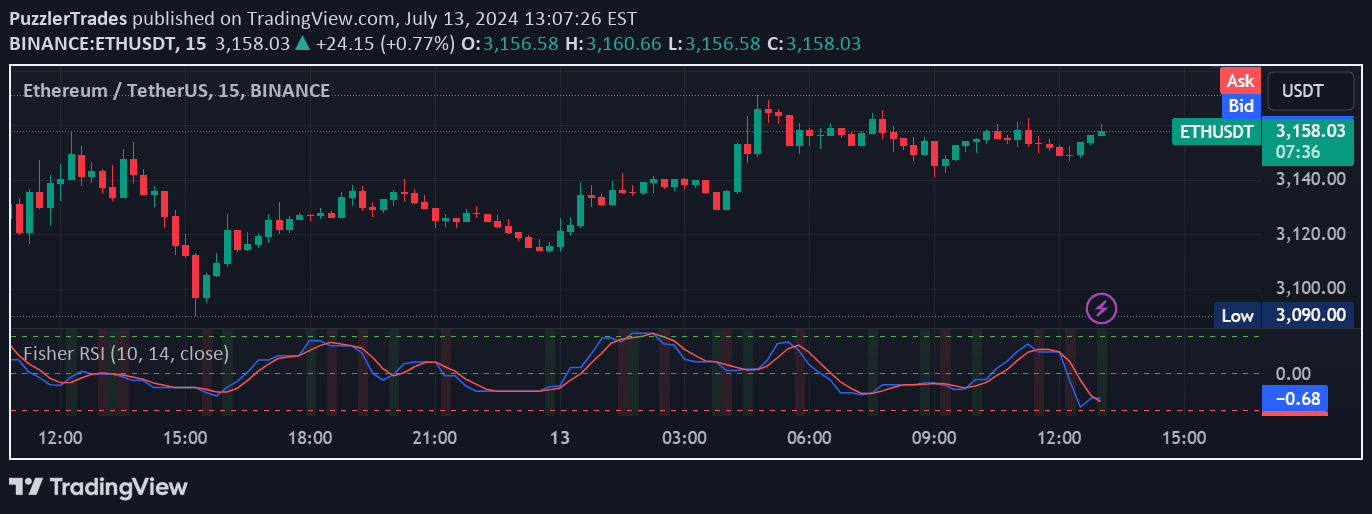
The Fisher Transform on RSI combines Relative Strength Index with Fisher Transform to detect market turning points by converting RSI values into a Gaussian normal distribution, enhancing signal precision.
Advanced Fractal and Hurst Indicator combines fractal dimension and Hurst exponent to analyze market trends, providing insights into price movement complexity and persistence.
A novel trend analysis tool using persistent homology to measure trend strength by tracking the persistence and stability of price movements across different market conditions.
Likes, views, and comments are historical TradingView snapshots. They describe attention, not trading performance.