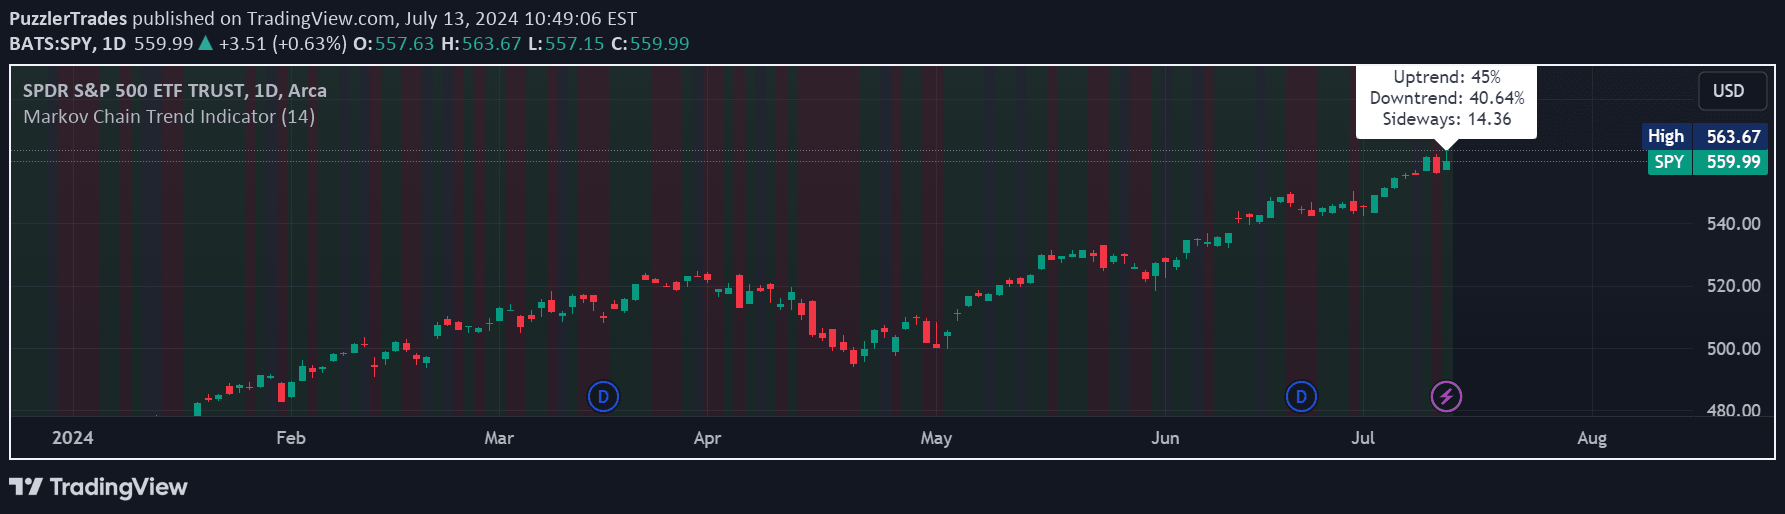
A Markov Chain Trend Indicator that analyzes stock price movements by calculating probabilities of transitioning between market states to predict potential future trends.
Explore complementary indicator rolesHow it works
The Markov Chain Trend Indicator begins by calculating logarithmic returns of stock prices to identify significant price movements. It categorizes these movements into three distinct states: Uptrend, Downtrend, and Sideways, using a probabilistic approach based on Markov Chain principles.
The indicator then creates transition matrices that track how frequently the price moves between these states. By analyzing historical data, it computes the probabilities of transitioning from one market state to another, which allows traders to anticipate potential future market behavior with a statistical foundation.
Why it may be useful
The Markov Chain Trend Indicator provides traders with a sophisticated mathematical approach to understanding market dynamics beyond traditional trend analysis. By quantifying the probabilities of market state transitions, it offers insights that can help traders make more informed and data-driven decisions about potential price movements.
Unlike purely visual trend indicators, this approach introduces a probabilistic framework that can potentially reveal subtle market patterns and transition likelihoods that might not be immediately apparent through conventional technical analysis methods.
When to explore it
The Markov Chain Trend Indicator is most effective in markets with clear, identifiable trend characteristics and sufficient historical price data for accurate probability calculations. It works best in relatively stable market conditions where price movements follow more predictable patterns and transitions between states can be meaningfully analyzed.
Traders should consider using this indicator in conjunction with other technical analysis tools to validate its signals and reduce the risk of false predictions. It is particularly useful for traders seeking a more quantitative and statistically grounded approach to trend analysis and market state prediction.
Keep exploring
What we’ve verified
Access, alerts and repainting behaviour have not been independently verified for this indicator. Check the creator’s current publication and settings.
General descriptions and classifications are recovered research. Verified details above identify the specific checks we have completed. Check the creator’s current publication for later changes.