Indicator Panel
A dynamic trading panel displaying multiple technical indicators in a color-coded table format, allowing traders to quickly assess market conditions across multiple symbols simultaneously.
Explore 11,183 indicators. Filter beyond the obvious.
Discover the tools that fit the way you trade.
11,183 tools to explore
A dynamic trading panel displaying multiple technical indicators in a color-coded table format, allowing traders to quickly assess market conditions across multiple symbols simultaneously.
A volume-adjusted momentum oscillator that identifies market impulse moves by combining price deviations with volume analysis to capture significant price movements and market strength.
An indicator that identifies bullish and bearish engulfing candlestick patterns to help traders detect potential trend reversals and market sentiment changes.
A Markov Chain Trend Indicator that analyzes stock price movements by calculating probabilities of transitioning between market states to predict potential future trends.
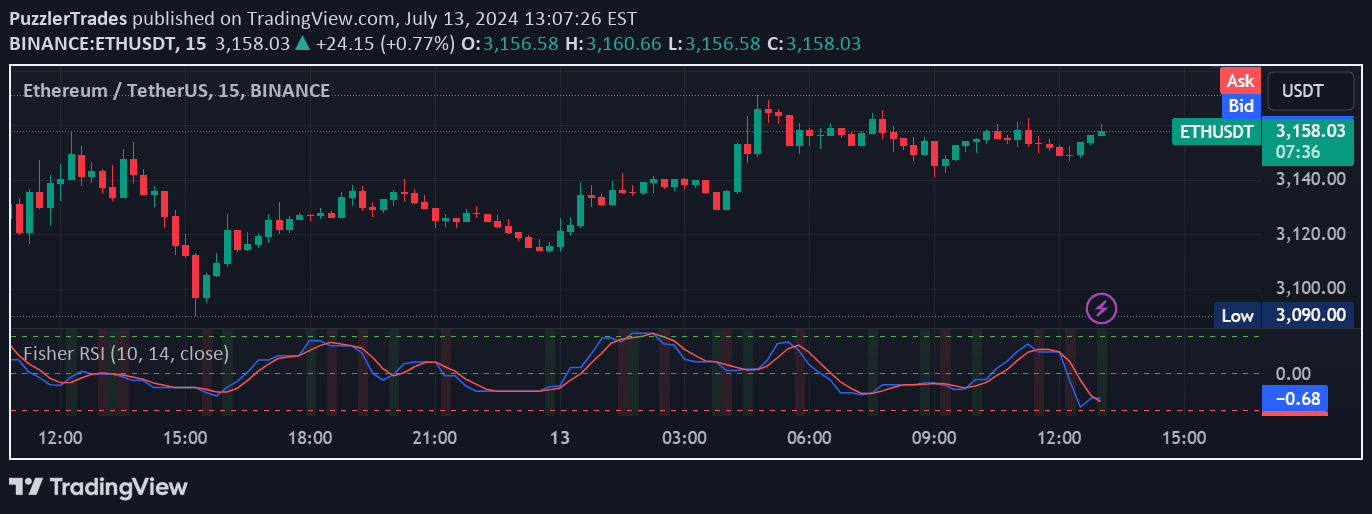
The Fisher Transform on RSI combines Relative Strength Index with Fisher Transform to detect market turning points by converting RSI values into a Gaussian normal distribution, enhancing signal precision.
A trading tool that identifies and highlights significant price candles based on predefined percentage movements, helping traders spot key market moments and potential trading opportunities.
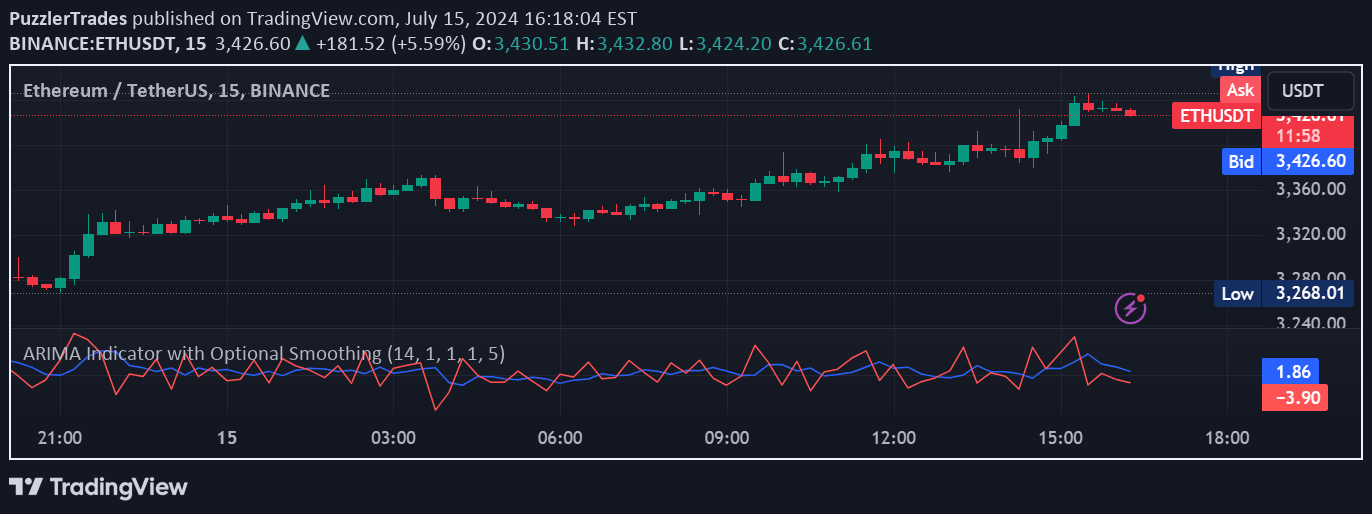
ARIMA Indicator forecasts price movements by analyzing historical data, combining autoregressive and moving average components to predict future trends and potential reversals.
A dual-stochastic indicator that allows simultaneous market analysis across different time frames, providing enhanced precision and flexibility in identifying potential trading signals.
A novel trend analysis tool using persistent homology to measure trend strength by tracking the persistence and stability of price movements across different market conditions.
A custom MACD indicator combining stochastic logic and Renko signals to help traders identify market momentum and trend changes with enhanced visual clarity.
Likes, views, and comments are historical TradingView snapshots. They describe attention, not trading performance.