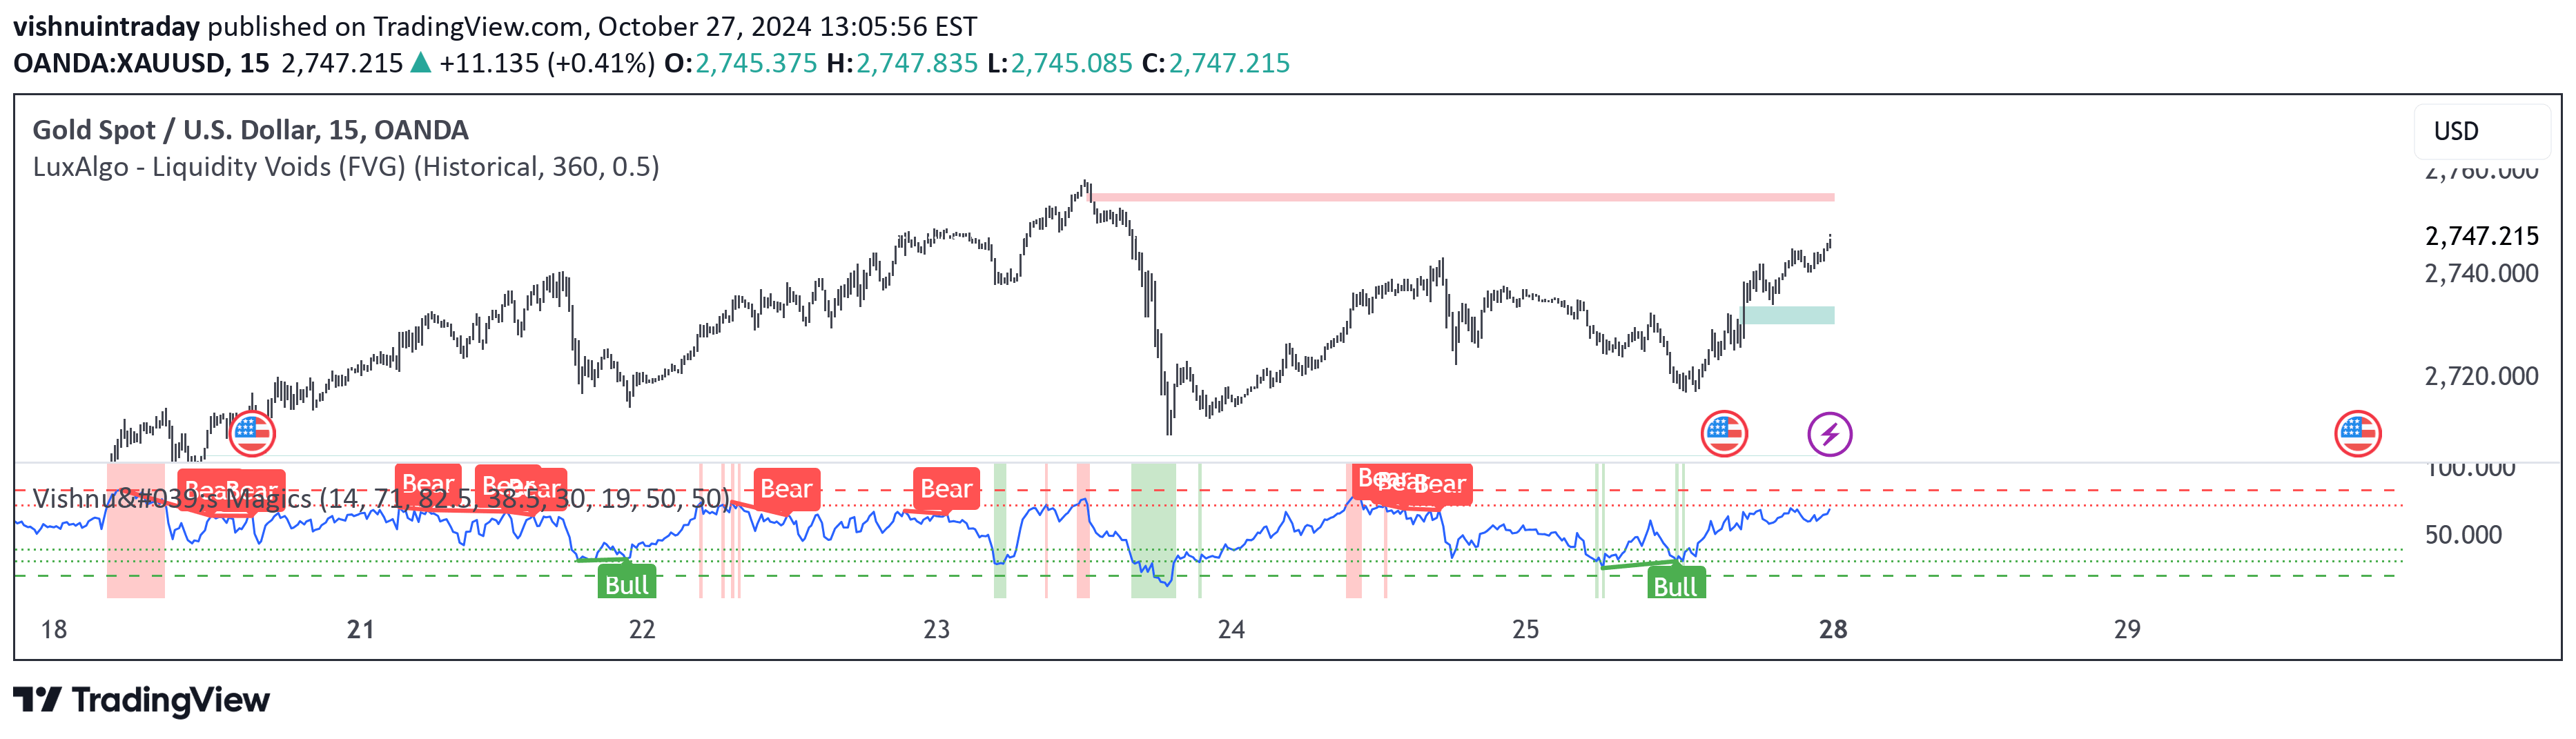
A custom MACD indicator combining stochastic logic and Renko signals to help traders identify market momentum and trend changes with enhanced visual clarity.
Explore complementary indicator rolesHow it works
The MasterDoFOMO MACD Visual calculates the MACD using exponential moving averages normalized by stochastic logic, which involves subtracting the lowest price from a defined period and dividing by the price range. This approach creates a more sensitive MACD indicator that is magnified by a factor of 10 for improved visualization.
The indicator generates additional signals through a simulated Renko direction method that uses Average True Range (ATR) to calculate brick sizes and determine trend changes. It plots a signal line as an EMA of the MACD and displays a color-coded histogram showing momentum, with green indicating bullish and purple indicating bearish market conditions.
Why it may be useful
The MasterDoFOMO MACD Visual provides traders with a sophisticated tool that combines multiple analytical approaches to reduce false signals and improve trading accuracy. By integrating stochastic MACD calculations with Renko directional signals, the indicator offers a more comprehensive view of market momentum and potential trend reversals.
This approach allows traders to gain deeper insights into market dynamics, helping them make more informed decisions about entry and exit points. The visual clarity and multi-layered signal generation make it particularly valuable for traders seeking to navigate complex and volatile market conditions.
When to explore it
The MasterDoFOMO MACD Visual is most effective in markets with clear momentum trends and moderate to high volatility. It works particularly well for traders who want to capture short to medium-term price movements and need a reliable method for identifying potential trend changes.
Traders should consider using this indicator when they want to combine multiple technical analysis techniques, such as momentum oscillators and trend direction signals. It is especially useful for day traders and swing traders who require a versatile tool that can help them quickly assess market conditions and potential trading opportunities.
Keep exploring
What we’ve verified
Access, alerts and repainting behaviour have not been independently verified for this indicator. Check the creator’s current publication and settings.
General descriptions and classifications are recovered research. Verified details above identify the specific checks we have completed. Check the creator’s current publication for later changes.