
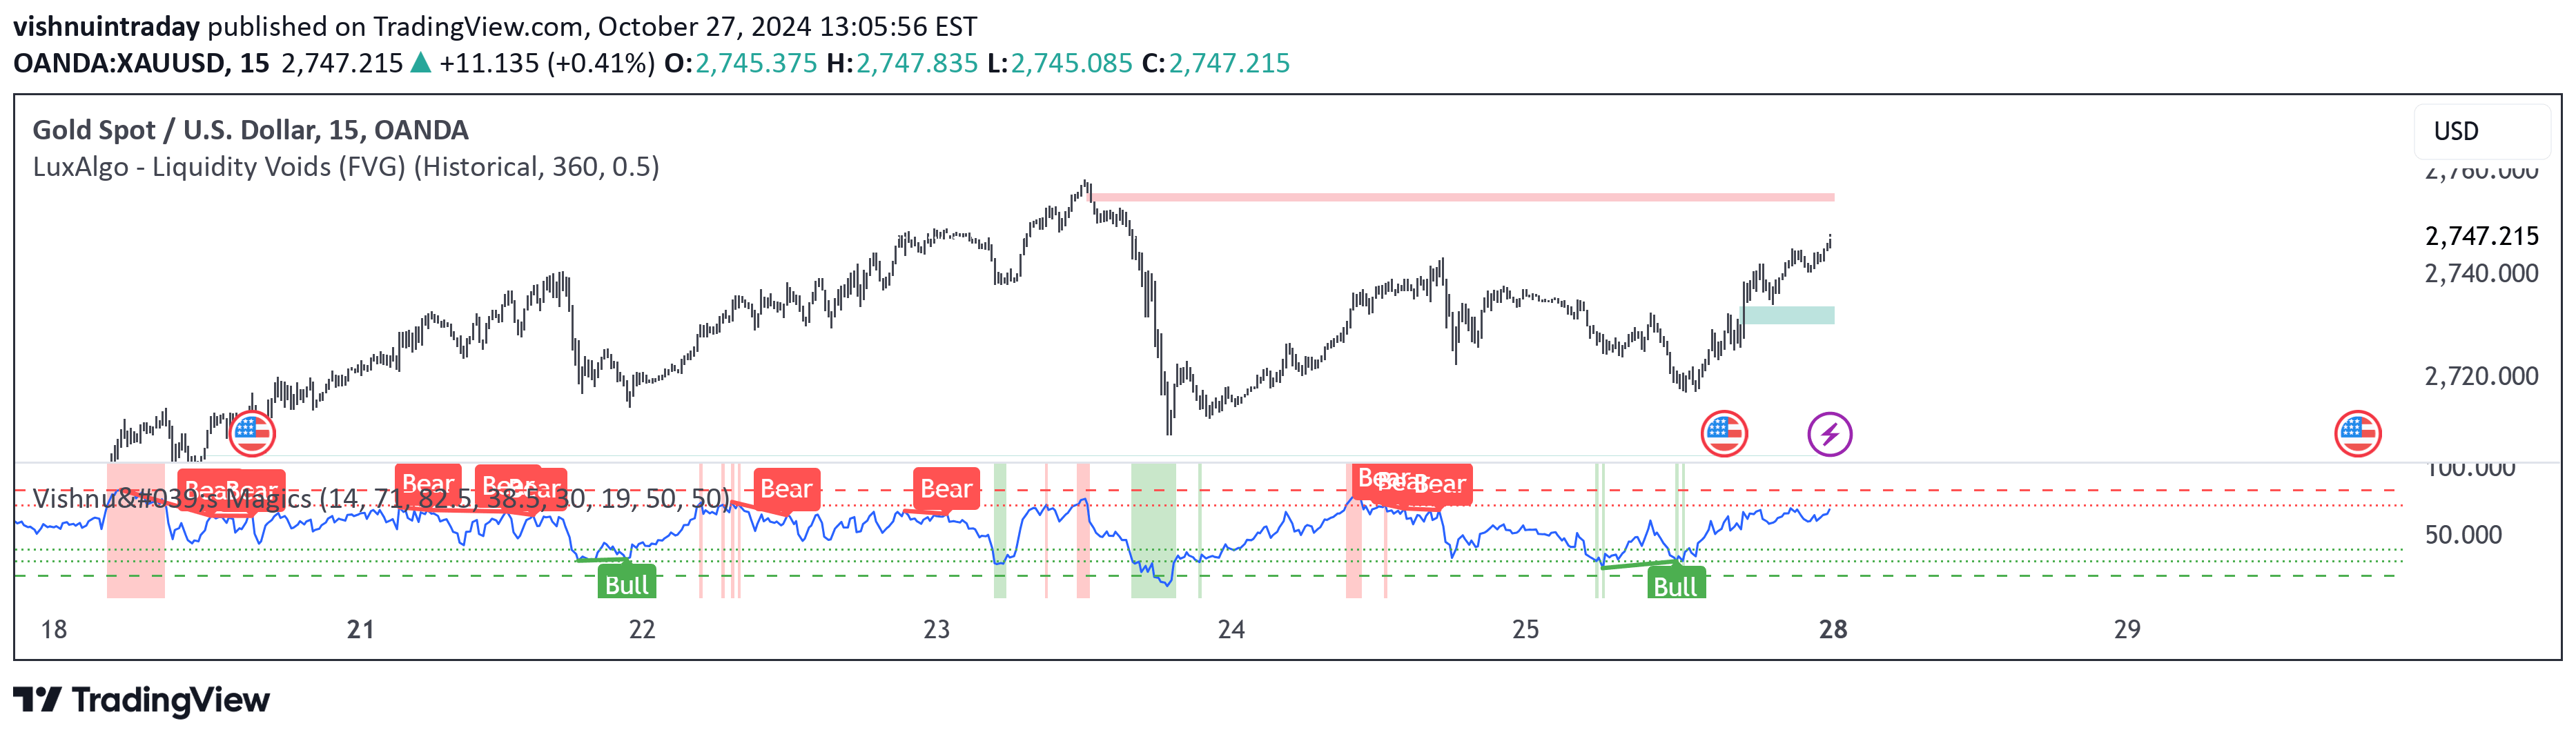
A powerful RSI indicator that detects divergences and provides customizable bands to help traders identify potential trend reversals and trading opportunities.
Explore complementary indicator rolesHow it works
Vishnu's Magics calculates the Relative Strength Index (RSI) over a user-defined length, tracking the momentum of price movements. It plots the RSI on a separate panel and allows traders to set multiple upper and lower bands to define overbought and oversold conditions. The indicator continuously compares price action with RSI movements to identify potential divergences.
When a divergence is detected, the indicator visually marks the chart with specific shapes and color changes. Bullish divergences are labeled as 'Bull', while bearish divergences are marked as 'Bear', providing traders with clear visual cues about potential trend reversals. Users can also customize divergence line values to suit their specific trading strategies.
Why it may be useful
The RSI indicator is crucial for traders seeking to understand market momentum and potential trend reversals. By analyzing the relationship between price movement and the RSI, traders can gain insights into whether an asset is overbought or oversold, helping them make more informed trading decisions.
The visual alerts and customizable features provide traders with a flexible tool for identifying potential entry and exit points. Divergence detection is particularly valuable as it can signal potential trend changes before they become apparent in price action. By highlighting these moments with distinct visual markers, Vishnu's Magics helps traders anticipate market shifts and develop more strategic trading approaches.
When to explore it
Vishnu's Magics is most effective in markets with clear trending or oscillating price movements. It works particularly well in volatile markets where momentum shifts can provide significant trading opportunities. Traders can use this indicator across various timeframes, from short-term scalping to longer-term swing trading, making it a versatile tool for different trading styles.
The indicator is especially useful during periods of market uncertainty, where traditional price analysis might not provide clear signals. By combining RSI calculations with divergence detection, traders can gain additional confirmation of potential trend reversals and make more confident trading decisions.
Keep exploring
What we’ve verified
Access, alerts and repainting behaviour have not been independently verified for this indicator. Check the creator’s current publication and settings.
General descriptions and classifications are recovered research. Verified details above identify the specific checks we have completed. Check the creator’s current publication for later changes.


