YOUR INDICATOR RESEARCH STARTS HERE

Find the right indicator.
Understand what it does.

Explore 11,183 indicators. Filter beyond the obvious.
Discover the tools that fit the way you trade.

THE INDICATOR LIBRARY

Results for “graph”

11,183 tools to explore

31 indicators matching your filters
Save search
SignalTrend

Swing Structure Scanner [LuxAlgo]

by LuxAlgo

A multi-ticker dashboard that visually tracks swing structures across different timeframes, helping traders identify potential trend formations and market confluence.

Separate pane · unverifiedDay Trading · Swing Trading
Explore
2.3Klikes54.8Kviews9comments
Save
SignalTrend

Market Condition Detector

by Fred6724

A chart background color indicator that helps traders identify market trend direction by analyzing price, moving averages, and market breadth on daily charts.

Main price chart · unverifiedSwing Trading
Explore
717likes8Kviews8comments
Save
SignalVolume

Stablecoin Dominance [LuxAlgo]

by LuxAlgo

A tool tracking the supply dominance of major stablecoins, showing their relative market share and evolution over time across different cryptocurrency markets.

Separate pane · unverifiedDay Trading · Swing Trading
Explore
680likes18.8Kviews1comments
Save
LevelsSignalTrend

Astro: Planetary Channel Lines

by BarefootJoey

Planetary Channel Lines analyze stock market trends by mapping planetary positions as support and resistance lines, using astronomical data to predict potential market turning points.

Main price chart · unverifiedDay Trading · Swing Trading
Explore
627likes17.9Kviews40comments
Save
TrendVolatilityEditor’s pick

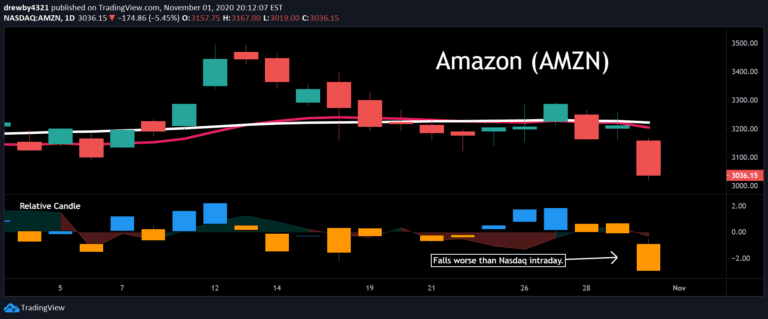
Relative Candle

by drewby4321

A visual indicator comparing a specific stock's daily performance against a market index, revealing relative price movements and potential anomalies in trading behavior.

Main price chart · unverifiedDay Trading · Swing Trading
Explore
419likes9.6Kviews15comments
Save
TrendMomentumEditor’s pick

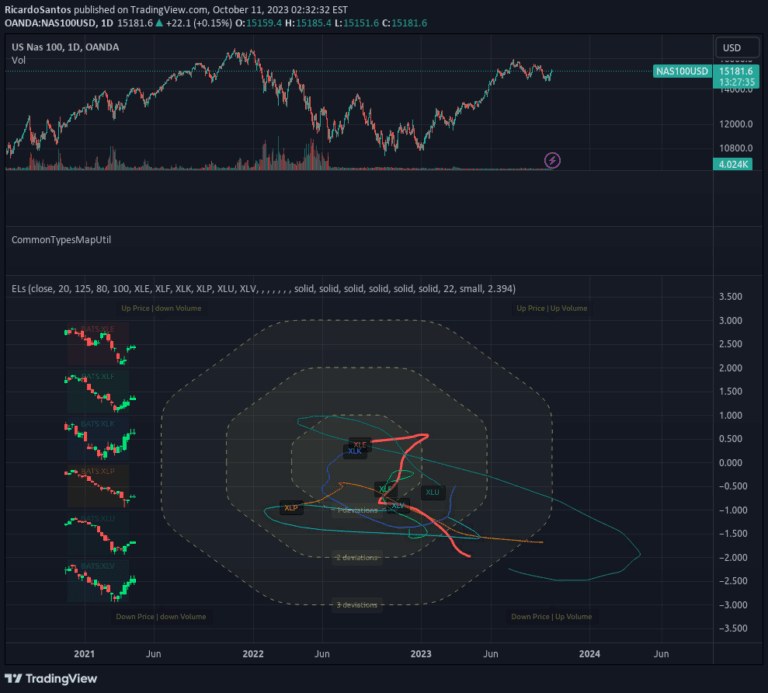
The Investment Clock Orbital Graph

by BarefootJoey

The Investment Clock Orbital Graph is a macro trading tool that visualizes economic cycles by tracking GDP growth and CPI inflation rates across different market phases.

Separate pane · unverifiedDay Trading · Swing Trading
Explore
375likes20.4Kviews6comments
Save
SignalTrendVolatility

Arbitrage Spread

by I_Leo_I

A cryptocurrency spread analysis tool that calculates correlation, z-score, and ATR z-score to help traders identify potential trading opportunities across different crypto pairs.

Separate pane · unverifiedScalping · Day Trading
Explore
280likes6.9Kviews4comments
Save

Likes, views, and comments are historical TradingView snapshots. They describe attention, not trading performance.

START WITH A QUESTION

A little less searching.
A lot more understanding.

Tell DeepAlpha what you need. Get an explanation, a shortlist,
and a direct path to the indicators behind it.

Ask DeepAlpha