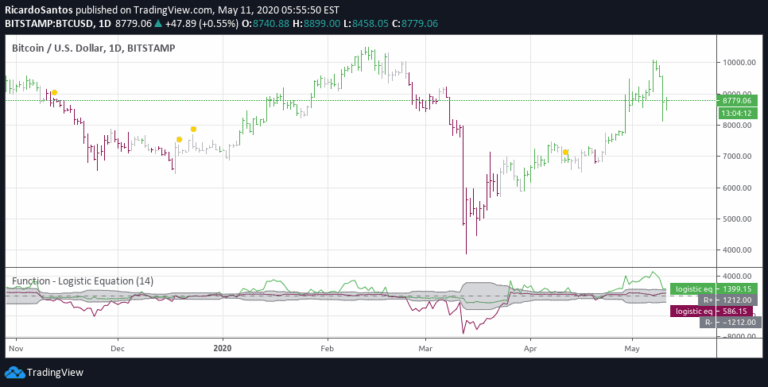
An experimental approach to visualizing RSI performance by mapping its changes across time, creating a unique four-dimensional scatter graph that reveals underlying price and momentum patterns.
Explore complementary indicator rolesHow it works
The signal creates a 4D visualization of RSI by plotting its fluctuations over a specific time period. It uses an inverted axis technique to enable comprehensive graphing of two key properties: price change and RSI movement.
By transforming traditional RSI into a scatter-like representation, traders can observe complex interactions between momentum and price that might not be visible in standard RSI charts. The method involves tracking RSI values over a 10-period window, allowing for a more dynamic interpretation of momentum shifts
Why it may be useful
This experimental approach provides traders with a novel perspective on momentum analysis by breaking traditional RSI visualization constraints. It allows for deeper insights into how RSI changes relate to price movements over time.
By presenting data in a multi-dimensional format, traders can potentially identify subtle momentum patterns and trend transitions that conventional indicators might miss. The technique enhances analytical capabilities by offering a more comprehensive view of market dynamics
When to explore it
This signal is most effective during periods of complex market transitions or when standard momentum indicators provide incomplete insights. It works best in markets with significant price volatility and when traders need a more nuanced understanding of momentum shifts.
Ideal for analyzing trending and ranging markets, particularly when traditional RSI interpretations seem ambiguous. Traders should use this method as a complementary tool alongside other technical analysis techniques
Keep exploring
What we’ve verified
Access, alerts and repainting behaviour have not been independently verified for this indicator. Check the creator’s current publication and settings.
General descriptions and classifications are recovered research. Verified details above identify the specific checks we have completed. Check the creator’s current publication for later changes.