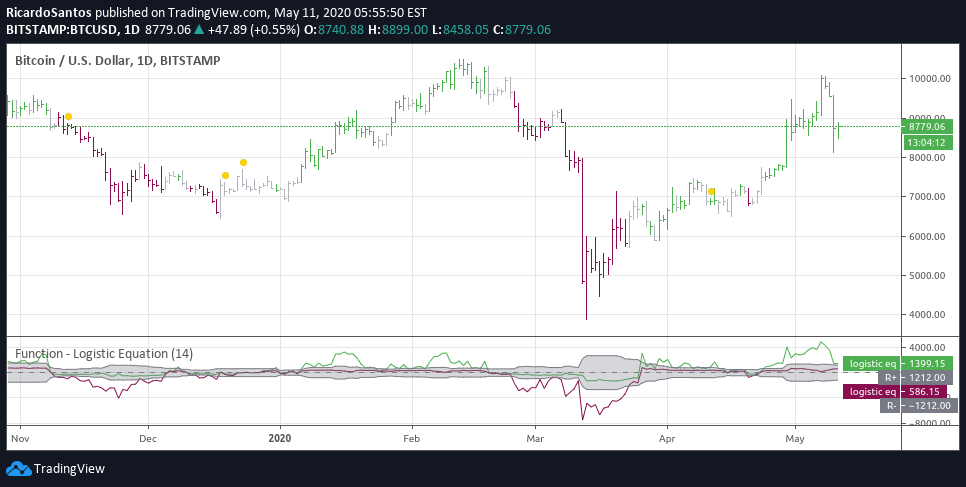
An experimental trading approach exploring the logistic equation's potential correlation with market dynamics, suggesting mathematical patterns might predict or explain market behavior.
Explore complementary indicator rolesHow it works
The logistic equation, a nonlinear mathematical model, maps complex dynamics using recursive calculations. By applying this equation to financial market data, traders can potentially identify underlying patterns and rhythmic behaviors. The equation generates values that change based on previous iterations, creating a feedback loop.
This method transforms raw market data into a structured mathematical representation. Traders analyze these transformed values to detect potential trend shifts or cyclical market movements. The approach leverages chaos theory principles to understand market complexity. Mathematical transformations help reveal hidden market structures not immediately visible through traditional analysis
Why it may be useful
Mathematical models like the logistic equation offer unique insights into market behavior beyond conventional technical analysis. They provide a systematic approach to understanding market complexity and potential predictive patterns. By treating financial markets as dynamic systems, traders can gain deeper understanding of underlying mechanisms.
These models challenge traditional linear thinking about market movements. They introduce probabilistic and chaotic perspectives that can complement existing trading strategies. Mathematical modeling helps traders recognize non-obvious market relationships. Such approaches expand analytical toolsets and promote more sophisticated market interpretation
When to explore it
The logistic equation approach works best during periods of market complexity and potential regime changes. It is most effective when traditional indicators show mixed or inconclusive signals. Traders should apply this method when seeking alternative analytical perspectives. The technique is particularly valuable during transitional market phases with high uncertainty.
It works well for traders comfortable with mathematical and probabilistic thinking. Best used as a supplementary analysis tool rather than a primary decision mechanism. Recommended for systematic traders who appreciate quantitative and experimental approaches to market analysis
Keep exploring
What we’ve verified
Access, alerts and repainting behaviour have not been independently verified for this indicator. Check the creator’s current publication and settings.
General descriptions and classifications are recovered research. Verified details above identify the specific checks we have completed. Check the creator’s current publication for later changes.