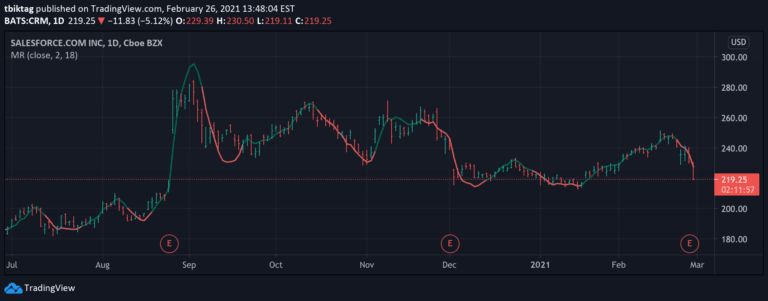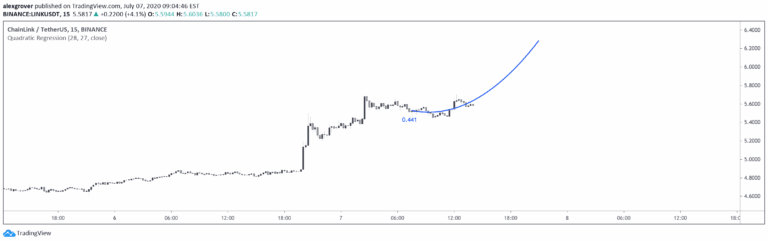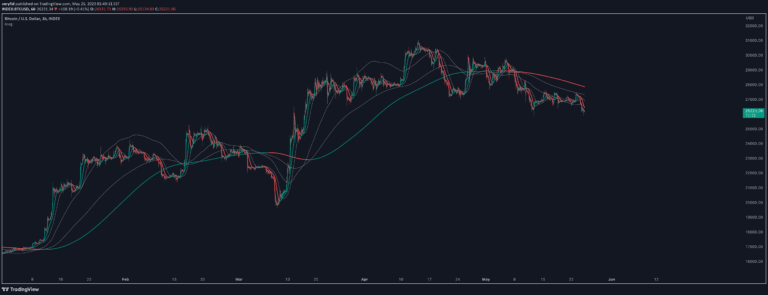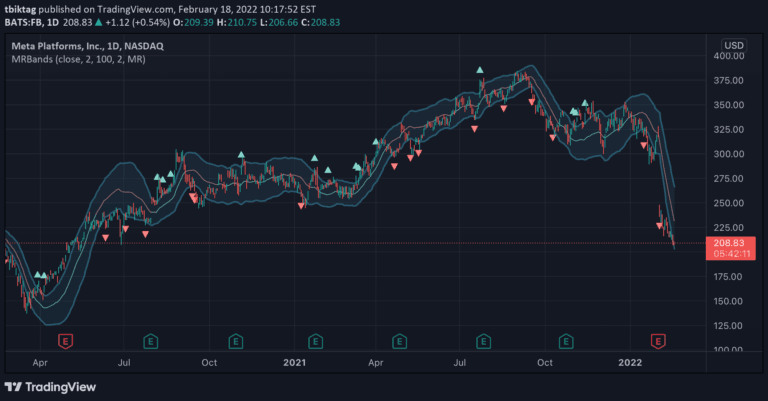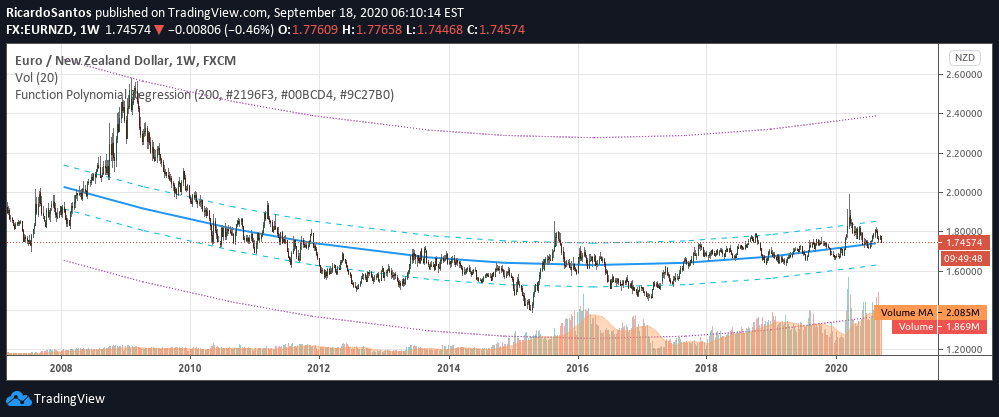
A polynomial regression function that analyzes data points to provide predictions, deviations, and statistical insights about trend and momentum patterns in financial datasets.
Explore complementary indicator rolesHow it works
Polynomial regression is a statistical method that fits a non-linear curve to data points using polynomial equations. It transforms input data into a predictive model by calculating coefficients that minimize the distance between the curve and actual data points.
The algorithm analyzes the relationship between x and y variables to create a mathematical representation of the trend. By selecting an appropriate polynomial degree, the model can capture complex patterns and relationships. The function calculates predictions, maximum and minimum deviations, and standard deviation to provide comprehensive statistical insights
Why it may be useful
Polynomial regression offers traders a sophisticated tool for understanding complex market dynamics beyond simple linear relationships. It helps identify non-linear trends and patterns that traditional linear models might miss.
By providing detailed deviation metrics, traders can assess potential price movements and market volatility more accurately. The method allows for more nuanced analysis of historical data, enabling better predictive modeling. It can reveal underlying market structures that are not immediately apparent through basic trend analysis
When to explore it
Polynomial regression is most effective when dealing with non-linear market data and complex trend patterns. It works best in markets with intricate price movements, such as cryptocurrency or emerging market stocks.
Traders should use this method when linear models fail to capture the full complexity of price behavior. It is particularly useful for long-term trend analysis and identifying potential trend reversals. The technique is valuable for creating predictive models in volatile or highly dynamic market conditions
Keep exploring
What we’ve verified
Access, alerts and repainting behaviour have not been independently verified for this indicator. Check the creator’s current publication and settings.
General descriptions and classifications are recovered research. Verified details above identify the specific checks we have completed. Check the creator’s current publication for later changes.