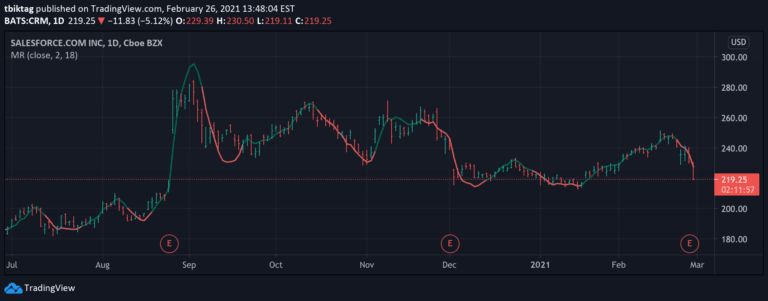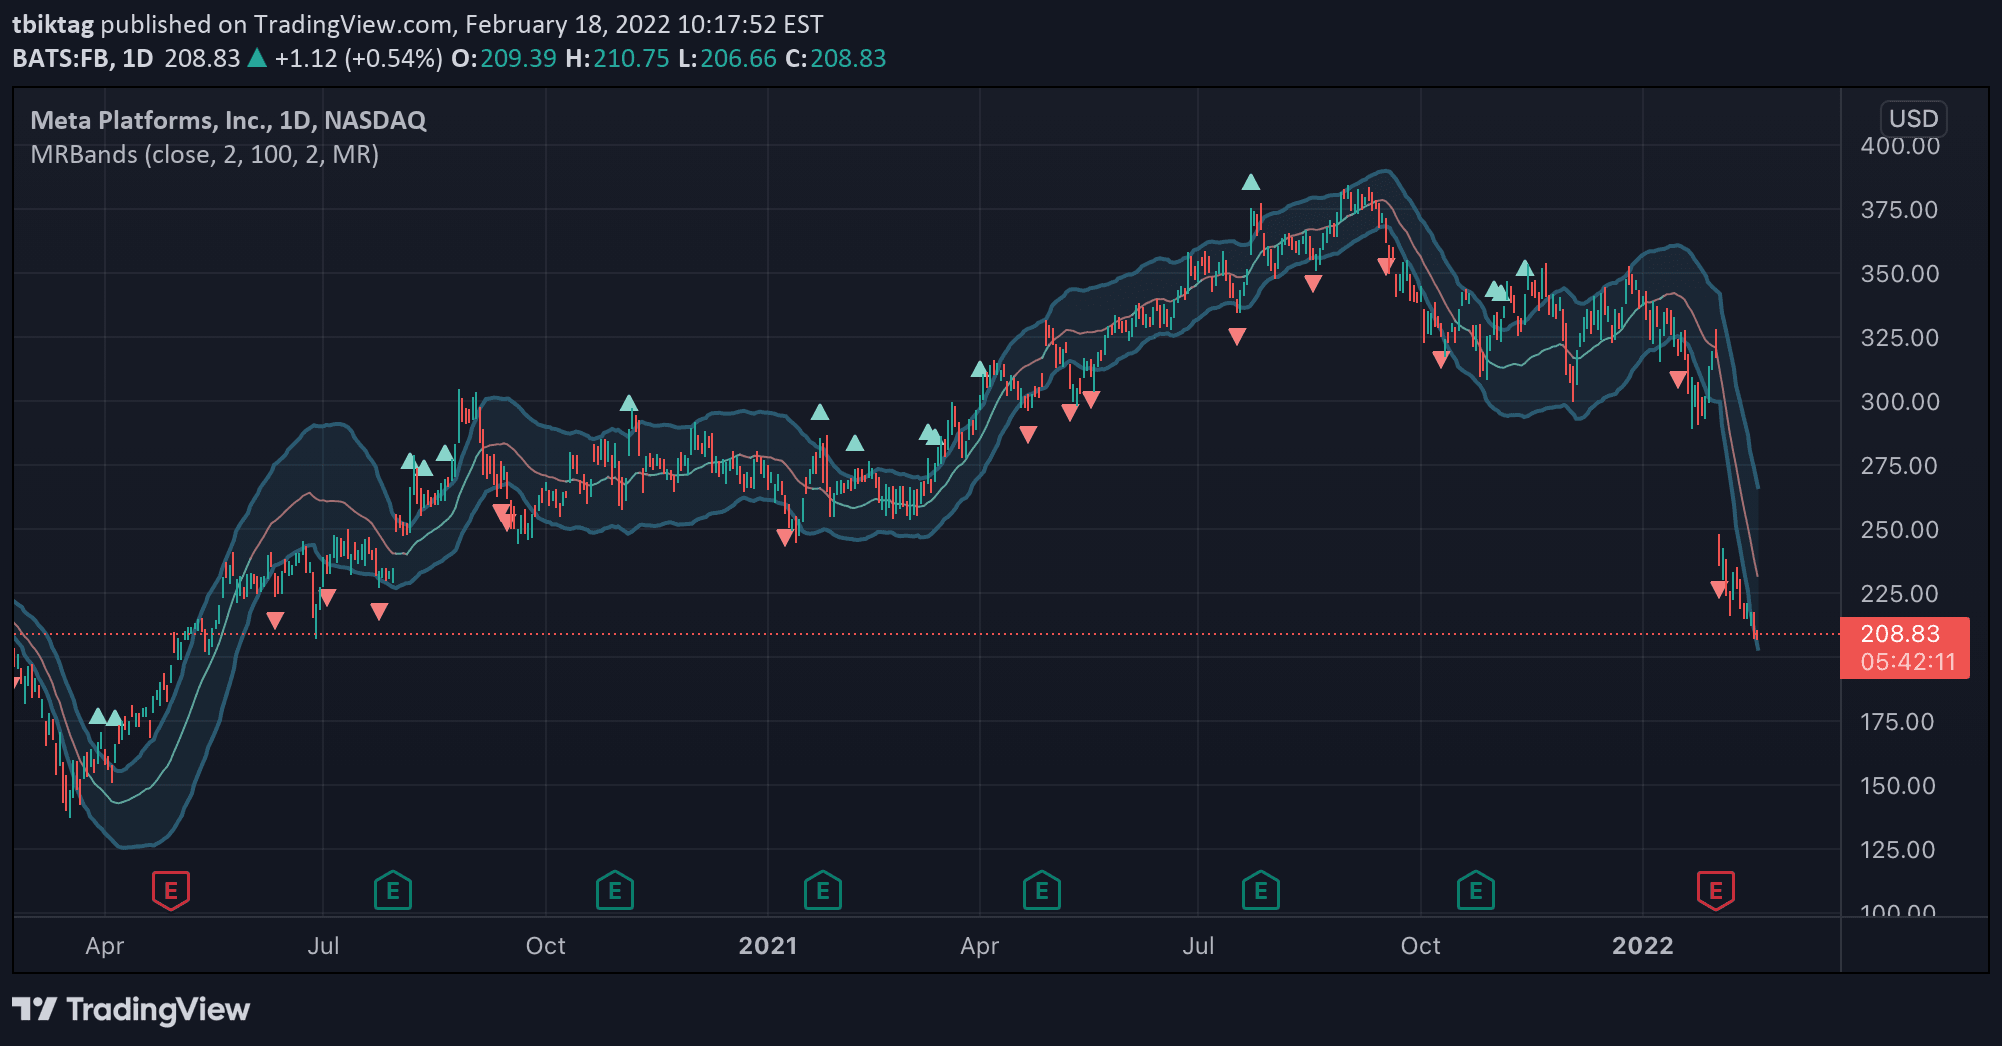
Moving Regression Prediction Bands combine regression analysis and statistical prediction to create a dynamic price prediction channel with upper and lower bands indicating potential price momentum and trend shifts.
Explore complementary indicator rolesHow it works
The Moving Regression Prediction Bands indicator uses local polynomial regression to analyze price data within a specified lookback window. It fits a polynomial to the data, predicting the next price point and calculating the root-mean-square error (RMSE).
The upper and lower bands are constructed by adding and subtracting the RMSE multiplied by a user-defined parameter from the predicted price. This creates a dynamic prediction channel that adapts to recent price movements and provides potential trend insights
Why it may be useful
This indicator helps traders understand potential price movements by creating a statistically-based prediction channel. By visualizing predicted price ranges and potential momentum shifts, traders can make more informed decisions about entry and exit points.
The bands provide a quantitative framework for assessing market trends, offering insights into potential breakouts and trend reversals. The flexibility of the multiplier parameter allows traders to adjust the prediction interval to their risk tolerance
When to explore it
The Moving Regression Prediction Bands work best in markets with clear trend characteristics and moderate volatility. They are particularly useful for swing and day traders looking to identify potential trend reversals and momentum shifts.
Traders should use this indicator in conjunction with other technical analysis tools to confirm signals. It is most effective in markets with sufficient historical data and relatively stable price movements, such as major currency pairs, large-cap stocks, and established commodities
Keep exploring
What we’ve verified
Access, alerts and repainting behaviour have not been independently verified for this indicator. Check the creator’s current publication and settings.
General descriptions and classifications are recovered research. Verified details above identify the specific checks we have completed. Check the creator’s current publication for later changes.