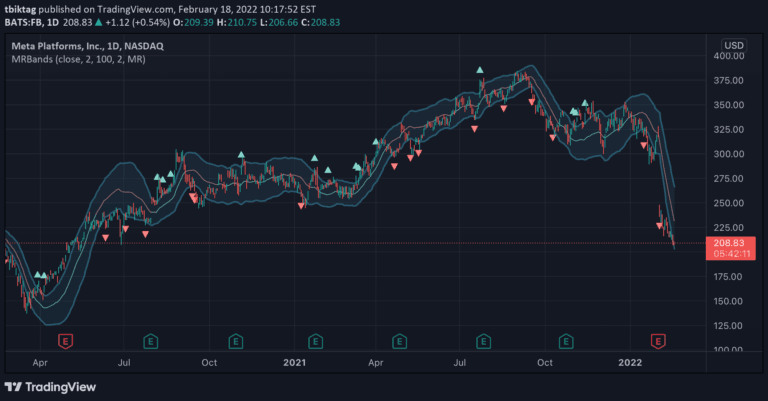
A comprehensive technical indicator combining Z-Scores, moving averages, and linear regression to analyze price momentum, volatility, and volume for potential market breakouts and trend reversals.
Explore complementary indicator rolesHow it works
The Composite Z-Score with Linear Regression Bands calculates Z-Scores across multiple Hull Moving Average lengths to normalize price momentum. By converting slope angles into standardized scores, the indicator captures both short-term and long-term price trends, providing a multi-timeframe analysis of market dynamics.
The indicator further enhances analysis by incorporating volume and volatility metrics into a composite value. This composite value helps identify market compression and expansion periods, while linear regression bands dynamically adjust support and resistance levels based on current market conditions, offering traders a comprehensive view of potential price movements.
Why it may be useful
The indicator provides traders with a sophisticated tool for understanding market momentum and potential trend reversals by integrating multiple analytical techniques into a single comprehensive signal. By combining Z-Scores, volume analysis, and adaptive regression bands, traders can gain deeper insights into market behavior beyond traditional single-metric indicators.
Its multi-length approach reduces market noise and increases signal reliability by cross-referencing momentum across different timeframes. The color-coded visualization and adaptive bands make it easier for traders to quickly interpret complex market information, potentially improving decision-making and trade entry/exit strategies.
When to explore it
The Composite Z-Score with Linear Regression Bands is most effective in markets with clear trending characteristics and moderate to high volatility. It performs exceptionally well in liquid markets like forex, major stock indices, and actively traded commodities where price movements exhibit consistent momentum patterns.
Traders should utilize this indicator during periods of potential trend initiation, breakout scenarios, and when seeking confirmation of existing market trends. It is particularly useful when combined with other technical analysis tools to validate signals and identify high-probability trading opportunities across different timeframes.
Keep exploring
What we’ve verified
Access, alerts and repainting behaviour have not been independently verified for this indicator. Check the creator’s current publication and settings.
General descriptions and classifications are recovered research. Verified details above identify the specific checks we have completed. Check the creator’s current publication for later changes.