YOUR INDICATOR RESEARCH STARTS HERE

Find the right indicator.
Understand what it does.

Explore 11,183 indicators. Filter beyond the obvious.
Discover the tools that fit the way you trade.

THE INDICATOR LIBRARY

Results for “polynomial”

11,183 tools to explore

25 indicators matching your filters
Save search
MomentumEditor’s pick

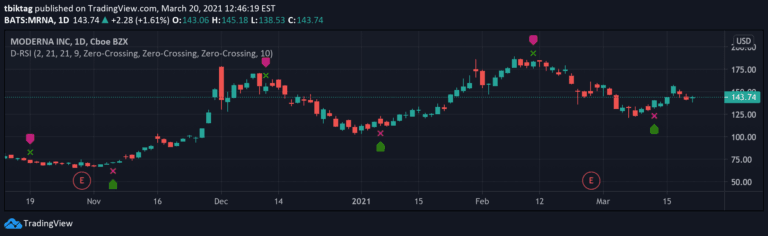
Delta-RSI Oscillator Strategy

by tbtkg

Delta-RSI Oscillator is a momentum indicator that measures the rate of change in RSI through a smoothed time derivative, providing dynamic insights into market momentum shifts.

Separate pane · unverifiedDay Trading · Swing Trading
Explore
6.5Klikes216.5Kviews72comments
Save
TrendVolatilityEditor’s pick

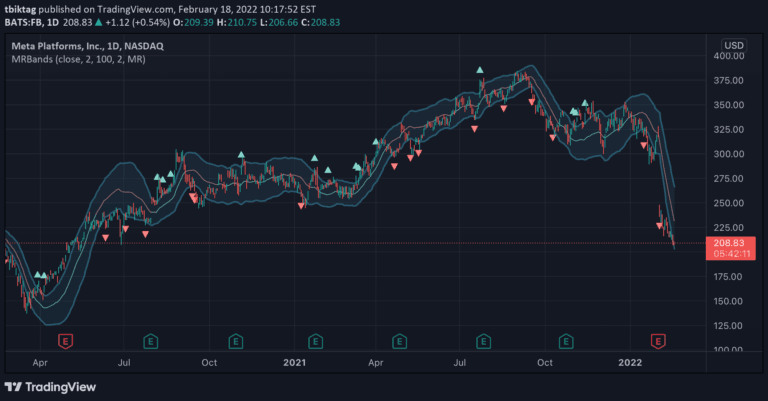
Moving Regression Prediction Bands

by tbtkg

Moving Regression Prediction Bands combine regression analysis and statistical prediction to create a dynamic price prediction channel with upper and lower bands indicating potential price momentum and trend shifts.

Main price chart · unverifiedDay Trading · Swing Trading
Explore
3.5Klikes100.6Kviews33comments
Save
TrendMomentumEditor’s pick

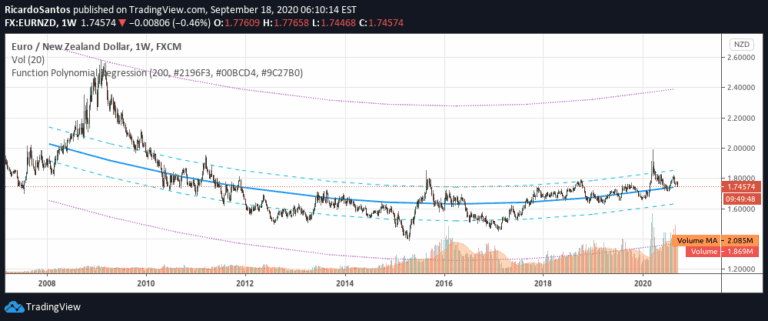
Function Polynomial Regression

by RicardoSantos

A polynomial regression function that analyzes data points to provide predictions, deviations, and statistical insights about trend and momentum patterns in financial datasets.

Main price chart · unverifiedDay Trading · Swing Trading
Explore
2.8Klikes40.5Kviews59comments
Save
TrendMomentumEditor’s pick

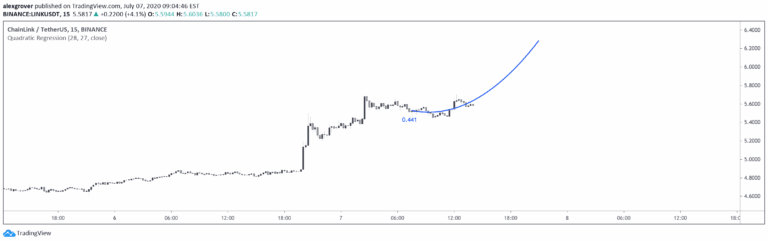
Quadratic Regression

by alexgrover

A quadratic regression indicator that fits a parabolic curve to price data, allowing traders to analyze non-linear trends and potentially forecast future price movements.

Main price chart · unverifiedDay Trading · Swing Trading
Explore
2.5Klikes45.8Kviews81comments
Save
TrendMomentumEditor’s pick

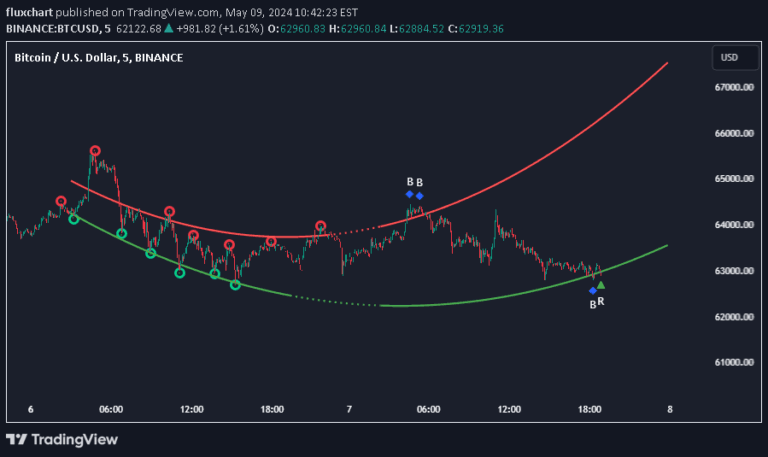
Polynomial Regression Bands + Channel [DW]

by DonovanWall

A polynomial regression indicator that calculates complex curve-fitting relationships between price variables, enabling advanced trend analysis and least squares moving average (LSMA) generation.

Main price chart · unverifiedDay Trading · Swing Trading
Explore
2Klikes61.6Kviews42comments
Save
ChannelsSignalTrend

Savitzky Flow Bands [ChartPrime]

by ChartPrime

An advanced trend-following tool using Savitzky-Golay smoothing to create dynamic trend bands that visualize market direction, strength, and potential reversals with color-coded insights.

Main price chart · unverifiedScalping · Day Trading
Explore
1.4Klikes16.9Kviews3comments
Save
TrendMomentumEditor’s pick

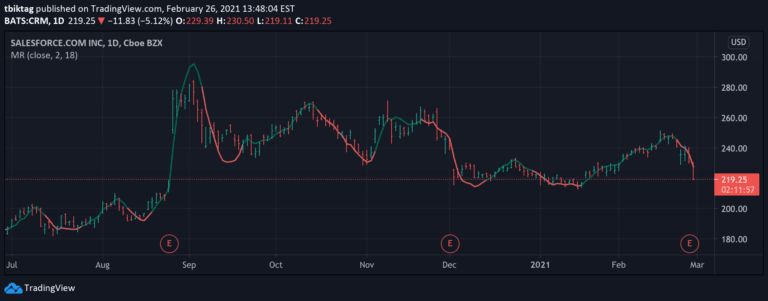
Moving Regression

by tbtkg

Moving Regression is a flexible trend analysis method that approximates data points using polynomial functions to smooth noise, assess momentum, and predict trend direction.

Main price chart · unverifiedDay Trading · Swing Trading
Explore
1.1Klikes23.4Kviews16comments
Save

Likes, views, and comments are historical TradingView snapshots. They describe attention, not trading performance.

START WITH A QUESTION

A little less searching.
A lot more understanding.

Tell DeepAlpha what you need. Get an explanation, a shortlist,
and a direct path to the indicators behind it.

Ask DeepAlpha