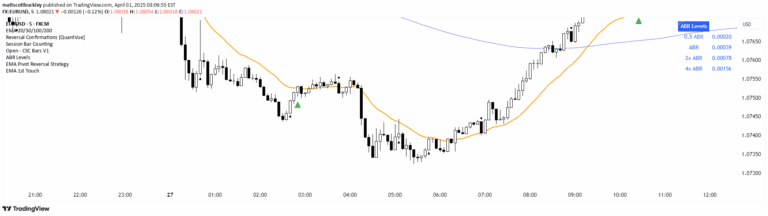
A trading strategy comparing Rate of Change indicators from Arnaud Legoux Moving Average and Exponential Moving Average to identify potential trend shifts and momentum changes.
Explore complementary indicator rolesHow it works
The strategy calculates Rate of Change (ROC) indicators using two different moving averages: a smoothed Arnaud Legoux Moving Average (ALMA) and a smoothed Exponential Moving Average (EMA). Within the ALMA calculation, a Gaussian function is applied to price data points, giving more weight to central points and reducing weight for distant points.
The ROC values are then compared to generate visual and trading signals. Histogram bars change color based on the relationship between the two ROC indicators, with green indicating ALMA outperforming EMA and red indicating underperformance. These color-coded bars help traders quickly identify potential trend momentum and direction.
Why it may be useful
This strategy provides traders with a nuanced view of market momentum by comparing two different moving average techniques. By utilizing the Gaussian-weighted ALMA and traditional EMA, traders can gain insights into subtle price movements and potential trend shifts that might be missed by simpler indicators.
The visual representation through color-coded histogram bars allows for quick interpretation of market dynamics, helping traders make more informed decisions about potential entry and exit points. The approach combines mathematical sophistication with user-friendly visualization.
When to explore it
The ALMA and EMA ROC comparison strategy works best in markets with clear trending characteristics, such as forex, stocks, and cryptocurrencies. It is particularly effective during periods of moderate volatility where price trends are developing and momentum is transitioning.
Traders should consider using this strategy on multiple timeframes, from short-term scalping to longer swing trading scenarios. It is most reliable when confirmed by additional technical indicators and fundamental market analysis, providing a comprehensive approach to identifying potential trading opportunities.
Keep exploring
What we’ve verified
Access, alerts and repainting behaviour have not been independently verified for this indicator. Check the creator’s current publication and settings.
General descriptions and classifications are recovered research. Verified details above identify the specific checks we have completed. Check the creator’s current publication for later changes.