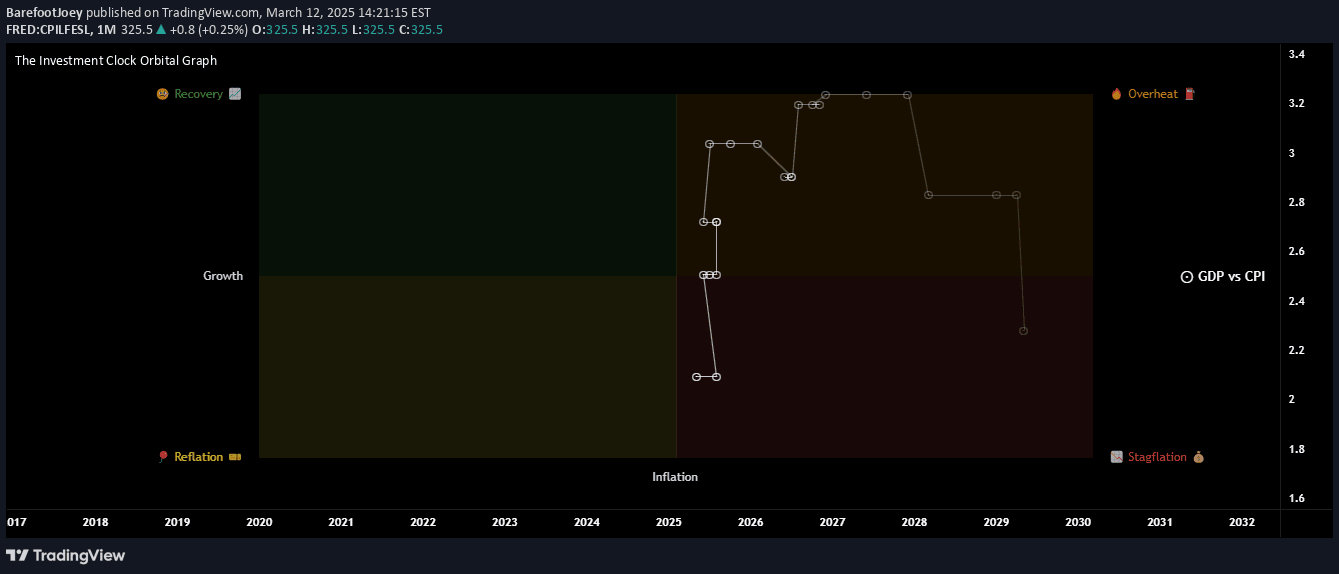
The Investment Clock Orbital Graph is a macro trading tool that visualizes economic cycles by tracking GDP growth and CPI inflation rates across different market phases.
Explore complementary indicator rolesHow it works
The Investment Clock Orbital Graph uses a scatter plot to map economic conditions by plotting GDP growth against CPI inflation. It divides the economic landscape into four quadrants: Overheating, Stagflation, Recovery, and Reflation. Each point represents a specific economic moment, showing how the economy moves through different phases.
The graph tracks the historical trajectory of economic indicators, creating an orbital path that reveals momentum and cyclical movements. By analyzing the position and movement of these points, traders can understand the current economic regime and potential future shifts
Why it may be useful
This indicator provides crucial macro insights for investors by transforming complex economic data into a visually intuitive format. It helps traders anticipate market trends, sector rotations, and potential central bank policy changes. By identifying the current economic quadrant, investors can strategically align their portfolio with prevailing market conditions.
The tool offers predictive capabilities by showing how economies transition between different phases, enabling more informed investment decisions. It bridges the gap between macroeconomic data and practical trading strategies, offering a comprehensive view of economic momentum
When to explore it
The Investment Clock Orbital Graph is most effective during periods of economic transition or uncertainty. Traders should use it when seeking to understand broader market trends beyond individual stock performance. It's particularly valuable when analyzing long-term investment strategies, sector rotation, and asset allocation.
The tool works best for investors interested in macro trends, central bank policies, and economic cycle analysis. It can help identify potential market shifts before they become obvious, providing a strategic advantage for proactive investors. Ideal for those managing diversified portfolios across different asset classes
Keep exploring
What we’ve verified
Access, alerts and repainting behaviour have not been independently verified for this indicator. Check the creator’s current publication and settings.
General descriptions and classifications are recovered research. Verified details above identify the specific checks we have completed. Check the creator’s current publication for later changes.