YOUR INDICATOR RESEARCH STARTS HERE

Find the right indicator.
Understand what it does.

Explore 11,183 indicators. Filter beyond the obvious.
Discover the tools that fit the way you trade.

THE INDICATOR LIBRARY

Results for “GDP”

11,183 tools to explore

27 indicators matching your filters
Save search
SignalVolatilityEditor’s pick

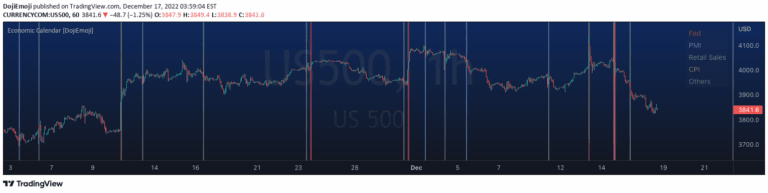
Live Economic Calendar by toodegrees

by toodegrees

Live Economic Calendar tracks global financial news events, providing real-time updates on market-moving events across multiple currencies with impact levels and detailed visualizations.

Main price chart · unverifiedDay Trading · Swing Trading
Explore
7Klikes131.6Kviews152comments
Save
TrendMomentumEditor’s pick

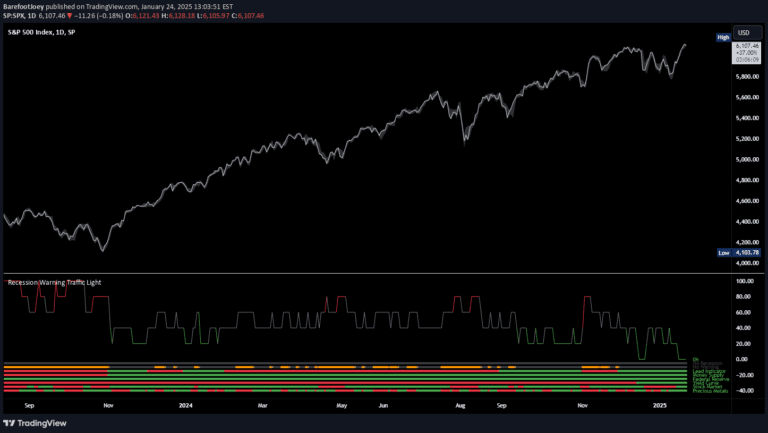
Recession Warning Traffic Light

by BarefootJoey

A multi-metric recession probability indicator using six key economic factors to assess potential economic downturns by analyzing various financial and market signals.

Separate pane · unverifiedSwing Trading
Explore
905likes35.6Kviews27comments
Save
TrendLevels

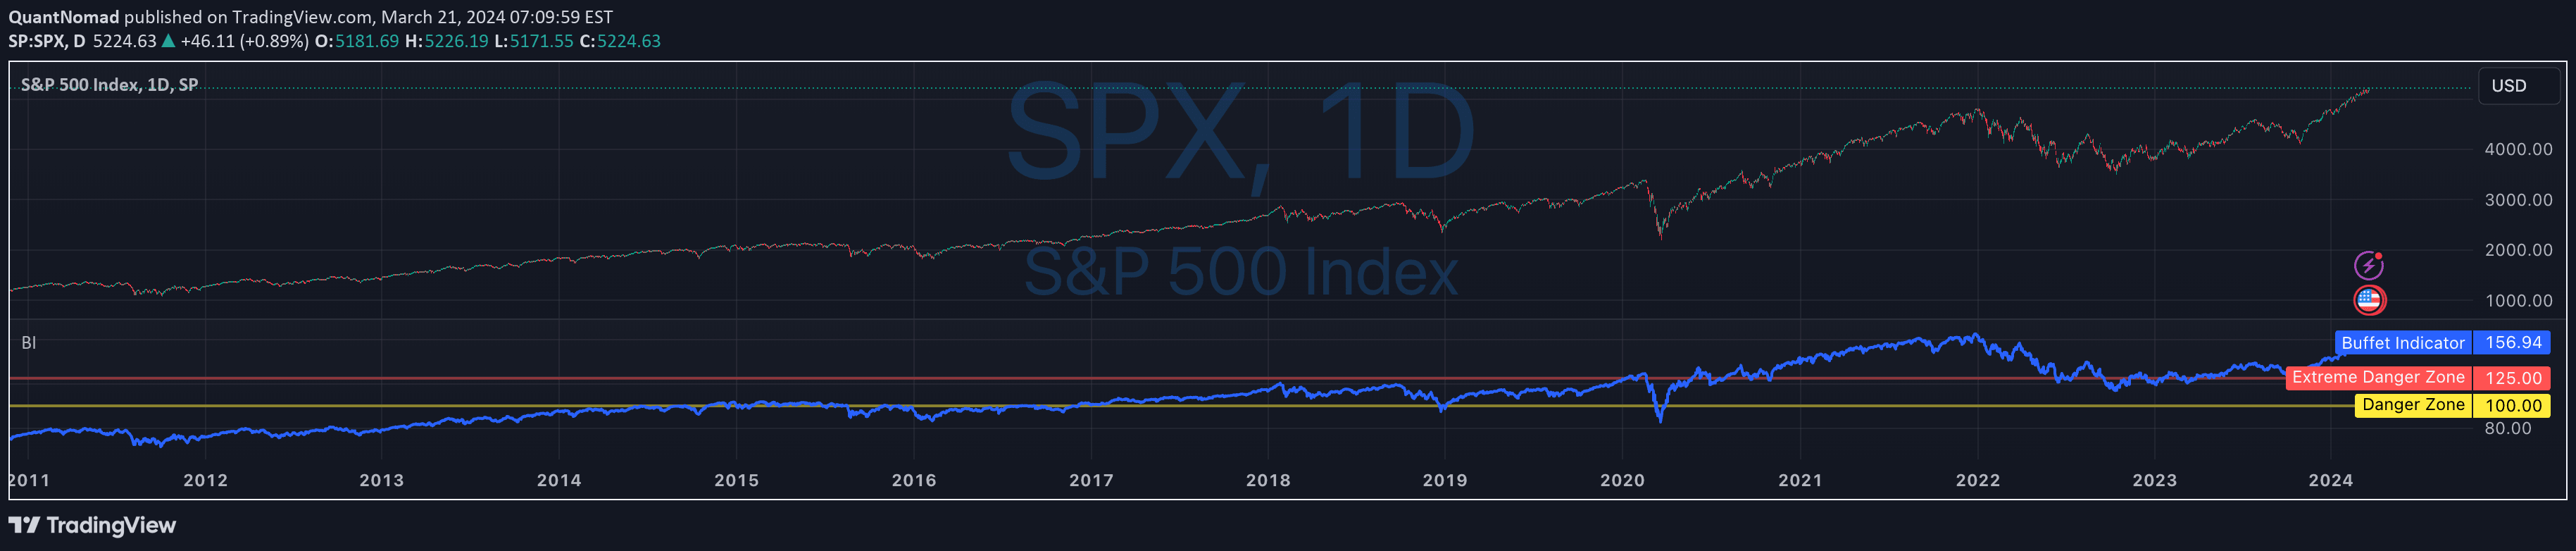
Buffett Indicator

by QuantNomad

A market valuation indicator comparing total stock market capitalization to US GDP, providing insight into potential market overvaluation or undervaluation.

Separate pane · unverifiedSwing Trading
Explore
399likes10.3Kviews1comments
Save
TrendMomentumEditor’s pick

The Investment Clock Orbital Graph

by BarefootJoey

The Investment Clock Orbital Graph is a macro trading tool that visualizes economic cycles by tracking GDP growth and CPI inflation rates across different market phases.

Separate pane · unverifiedDay Trading · Swing Trading
Explore
375likes20.4Kviews6comments
Save
LevelsSignalVolatility

Buffett Valuation Indicator [TradeDots]

by tradedots

The Buffett Valuation Indicator assesses stock market valuation by comparing total market capitalization to GDP, using Bollinger Bands to identify overvalued or undervalued market conditions.

Separate pane · unverifiedDay Trading · Swing Trading
Explore
253likes5.6Kviews0comments
Save
Trend

Econometrica by [SS]

by Steversteves

Econometrica is a sophisticated mathematical indicator that bridges technical and fundamental analysis by creating regression models that predict ticker values using key US economic data metrics.

Main price chart · unverifiedDay Trading · Swing Trading
Explore
83likes1.6Kviews4comments
Save
SignalTrend

Excess Liquidity Indicator

by mks17

An advanced liquidity indicator that combines macroeconomic factors to estimate market trends by analyzing global money supply, central bank balance sheets, and economic indicators.

Separate pane · unverifiedDay Trading · Swing Trading
Explore
69likes2Kviews0comments
Save

Likes, views, and comments are historical TradingView snapshots. They describe attention, not trading performance.

START WITH A QUESTION

A little less searching.
A lot more understanding.

Tell DeepAlpha what you need. Get an explanation, a shortlist,
and a direct path to the indicators behind it.

Ask DeepAlpha