
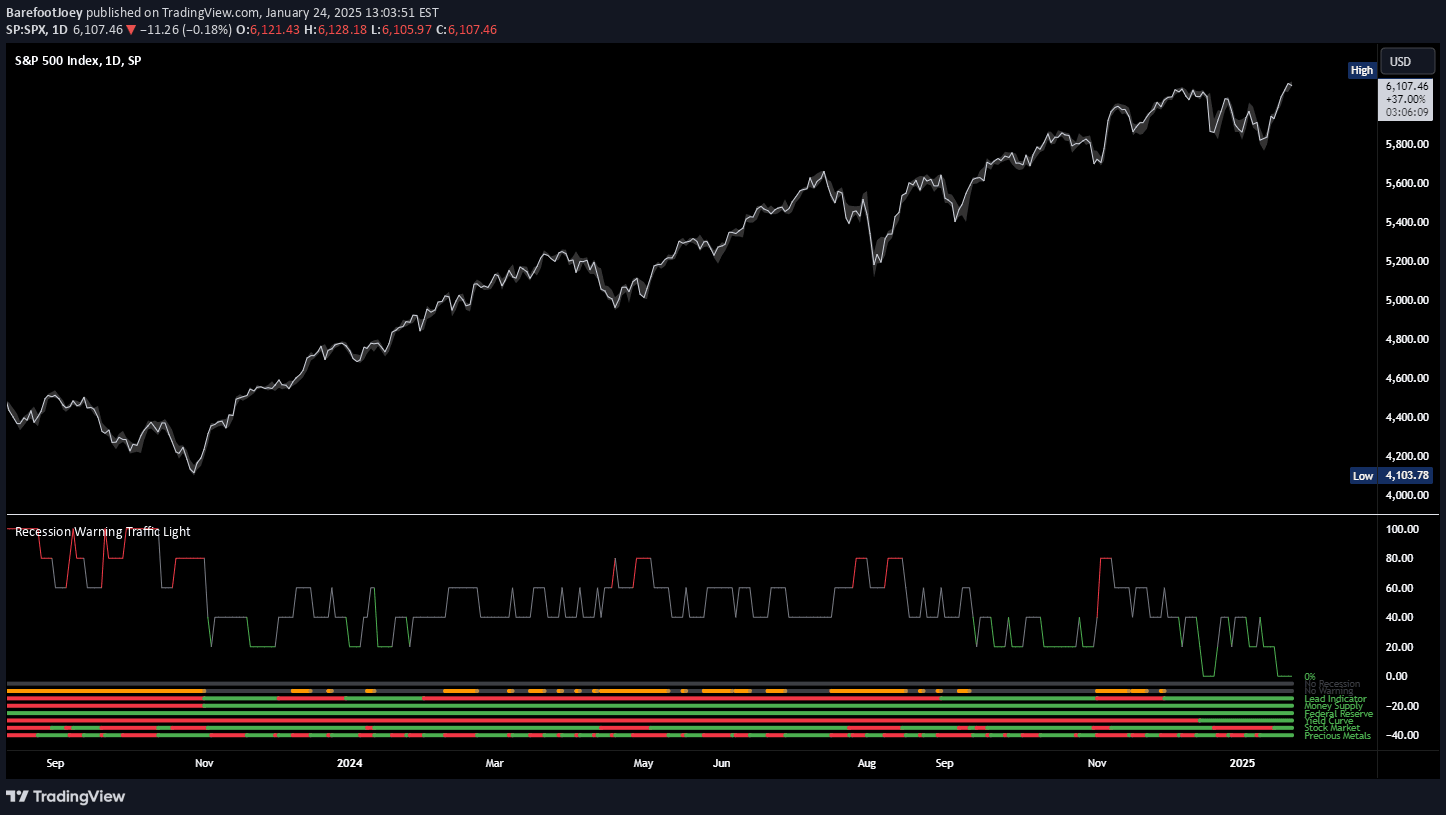
A multi-metric recession probability indicator using six key economic factors to assess potential economic downturns by analyzing various financial and market signals.
Explore complementary indicator rolesHow it works
This recession indicator integrates six diverse economic metrics to calculate recession probability. It evaluates precious metals pricing, stock market indices performance, treasury yield curve inversions, Federal Reserve GDP measurements, money supply changes, and leading economic factors.
Each metric contributes a color-coded warning signal, with green indicating stability and red signaling potential economic contraction. By aggregating these signals, traders can assess the cumulative probability of an impending recession and make informed investment decisions
Why it may be useful
Understanding recession probability is crucial for investors and traders to protect capital and adjust investment strategies proactively. This comprehensive indicator provides early warning signals before economic downturns, helping market participants anticipate potential market shifts.
By analyzing multiple economic indicators simultaneously, traders can gain a more holistic view of economic health. The indicator's multi-metric approach reduces reliance on single-factor predictions, offering a more robust economic assessment tool
When to explore it
This recession indicator is most effective during periods of economic uncertainty or potential market transitions. Traders should closely monitor this signal when experiencing significant market volatility, unusual economic indicators, or global economic disruptions.
It is particularly useful for long-term investors, portfolio managers, and strategic traders seeking to protect investments during potential economic contractions. The indicator provides valuable insights for asset allocation, risk management, and strategic investment planning
Keep exploring
What we’ve verified
Access, alerts and repainting behaviour have not been independently verified for this indicator. Check the creator’s current publication and settings.
General descriptions and classifications are recovered research. Verified details above identify the specific checks we have completed. Check the creator’s current publication for later changes.


