Recession Warning Traffic Light
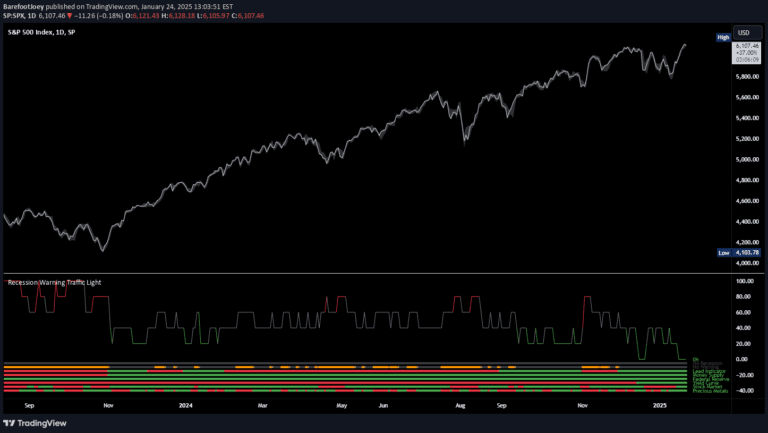
A multi-metric recession probability indicator using six key economic factors to assess potential economic downturns by analyzing various financial and market signals.
Explore 11,183 indicators. Filter beyond the obvious.
Discover the tools that fit the way you trade.
11,183 tools to explore
A multi-metric recession probability indicator using six key economic factors to assess potential economic downturns by analyzing various financial and market signals.
A yield curve indicator tracking the percentage of Treasury Bond yield spreads that are inverted, providing insights into potential economic downturns and market sentiment.
A sophisticated Fibonacci tool that helps traders identify key support and resistance levels through linear and logarithmic levels, and Fibonacci fans for comprehensive market analysis.
Treasury Yields Heatmap is a dynamic tool tracking bond values and yield curve status across different countries using Pearson's linear regression coefficient.
Unemployment rate measures the percentage of jobless individuals seeking work, serving as a critical economic health indicator tracking labor market conditions and potential economic shifts.
A graph tracking earnings per share (EPS) growth using a trailing simple moving average, highlighting earnings recessions and expansions, with signals generated by earnings estimates.
The US Composite Leading Indicator is an economic forecasting tool that aggregates multiple economic and financial data points to predict future market trends and potential economic shifts.
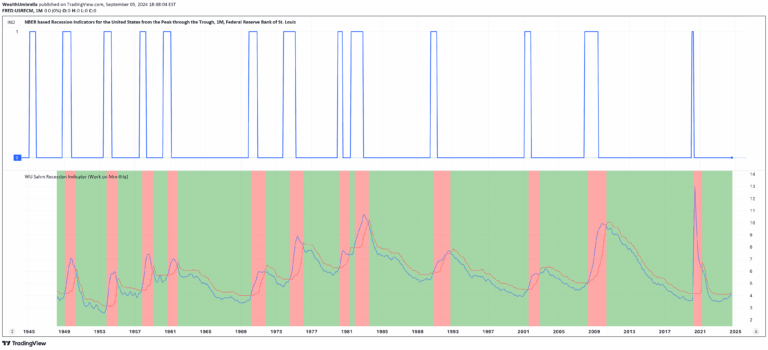
The Sahm Recession Indicator provides a real-time method to detect potential economic recessions by analyzing unemployment rate changes, helping traders anticipate market shifts.
A yield curve inversion indicator that tracks the relationship between different interest rates to predict potential economic recessions and market conditions.
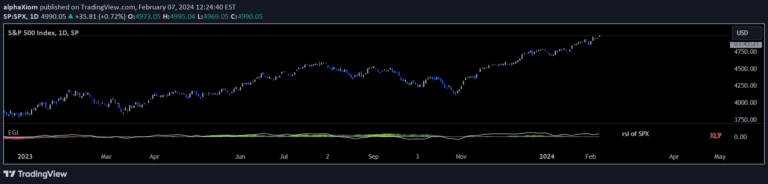
Economic Growth Index (EGI) tracks the relationship between consumer discretionary and staples ETFs to indicate economic expansion or contraction, providing market sentiment insights.
Federal Reserve's monetary policy strategy of expanding or reducing balance sheet through buying or selling securities to manage economic conditions and market liquidity.
The Buffett Indicator compares total US stock market capitalization to GDP, revealing market valuation levels and potential over or undervaluation across different economic periods.
Likes, views, and comments are historical TradingView snapshots. They describe attention, not trading performance.