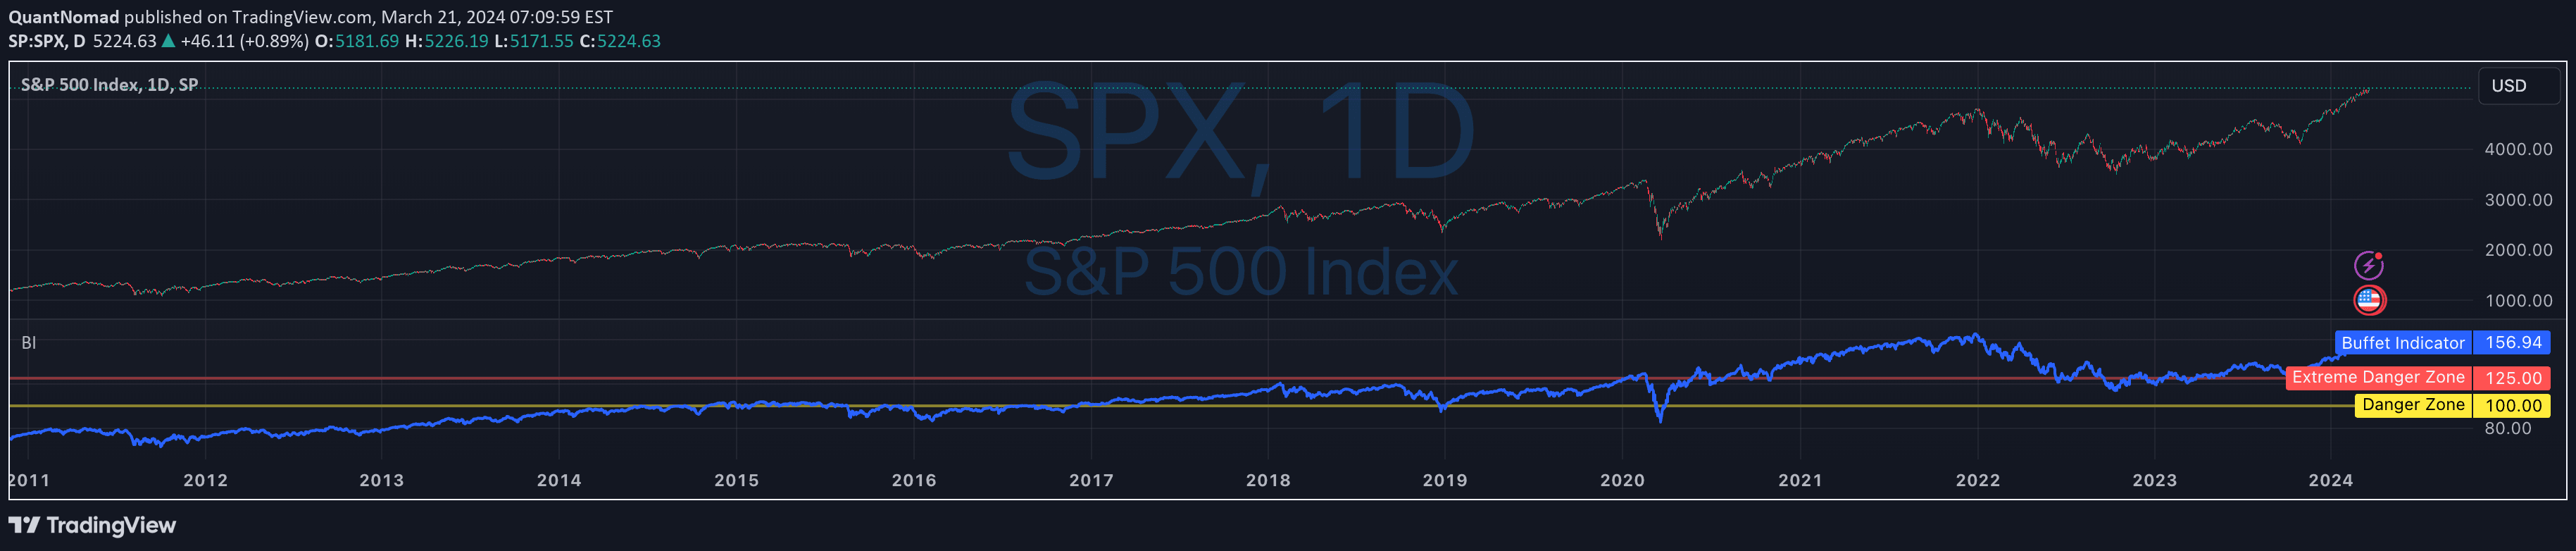
The Buffett Indicator compares total US stock market capitalization to GDP, revealing market valuation levels and potential over or undervaluation across different economic periods.
Explore complementary indicator rolesHow it works
The Buffett Indicator calculates the ratio between total market capitalization (using the Wilshire 5000 Index) and the current Gross Domestic Product (GDP). By comparing these two economic metrics, it provides a percentage that represents market valuation relative to the overall economic output.
When the ratio is higher, it suggests the market is overvalued, and when lower, it indicates potential undervaluation. The indicator uses dynamic calculations to track changes in market capitalization and GDP over time, offering a macro-level perspective on market conditions
Why it may be useful
The Buffett Indicator offers investors a sophisticated macroeconomic tool for understanding market valuation beyond traditional price-based analysis. It helps identify potential market bubbles and periods of economic exuberance or depression.
By providing a broader economic context, traders and investors can make more informed long-term investment decisions. The indicator bridges the gap between stock market performance and actual economic productivity, offering insights into whether current market prices reflect genuine economic value
When to explore it
This indicator is most effective for long-term investors and macro strategists analyzing overall market conditions. It works best during periods of significant economic transition, such as post-crisis recoveries or pre-recession environments.
Investors should use it alongside other fundamental and technical analysis tools. The Buffett Indicator is particularly useful when evaluating portfolio allocation, assessing potential market corrections, and understanding broader economic trends that might impact investment strategies
Keep exploring
What we’ve verified
Access, alerts and repainting behaviour have not been independently verified for this indicator. Check the creator’s current publication and settings.
General descriptions and classifications are recovered research. Verified details above identify the specific checks we have completed. Check the creator’s current publication for later changes.