Global Liquidity Index
Global Liquidity Index tracks worldwide central bank balance sheets, providing a comprehensive view of global monetary conditions and potential market trends through consolidated financial data.
Explore 11,183 indicators. Filter beyond the obvious.
Discover the tools that fit the way you trade.
11,183 tools to explore
Global Liquidity Index tracks worldwide central bank balance sheets, providing a comprehensive view of global monetary conditions and potential market trends through consolidated financial data.
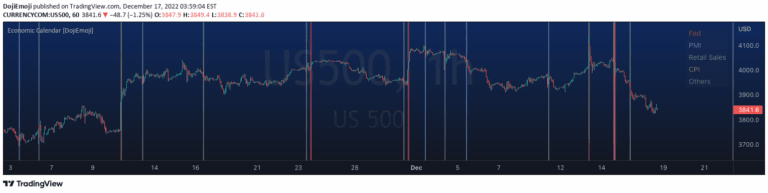
A trading script that automatically draws vertical lines marking economic calendar events using predefined datetime inputs, helping traders visually track significant market events.
A comprehensive market analysis tool tracking cross-market correlations and equity factor performance across multiple assets to provide probabilistic insights into macro market regimes and potential future movements.
A comprehensive macro analysis tool tracking multiple assets and market regimes to provide insights into market performance, risk states, and potential economic trends.
A comprehensive market analysis tool tracking 15 ETFs to provide insights into market trends, performance, and macroeconomic regime positioning across different economic environments.
The Bitcoin to Gold Ratio (BTGR) compares Bitcoin and Gold prices to analyze market sentiment and potential trading opportunities across different asset classes.
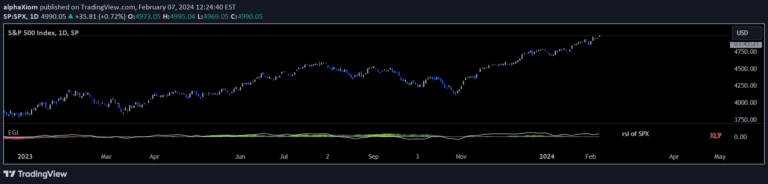
Economic Growth Index (EGI) tracks the relationship between consumer discretionary and staples ETFs to indicate economic expansion or contraction, providing market sentiment insights.
The Buffett Indicator compares total US stock market capitalization to GDP, revealing market valuation levels and potential over or undervaluation across different economic periods.
A unique momentum trading strategy that combines price momentum with key macroeconomic indicators to generate comprehensive trading signals using normalized economic data and technical analysis.
A technical indicator using James Hamilton's method to visually highlight US recession periods, providing macroeconomic context for trading decisions and economic analysis.
A dynamic credit spread monitoring indicator that tracks High Yield and Investment Grade bond yields against US Treasury yields to assess market stress and potential economic inflection points.
US bond yield curve inversion signals potential economic downturn by comparing 10-year and 2-year Treasury bond yields, indicating economic sentiment and potential recession risks.
Likes, views, and comments are historical TradingView snapshots. They describe attention, not trading performance.