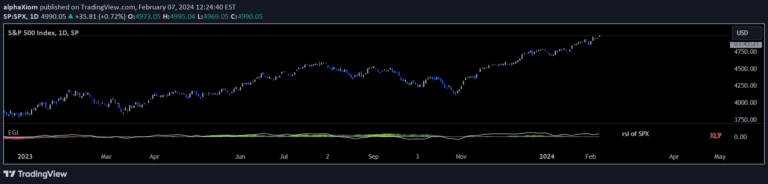
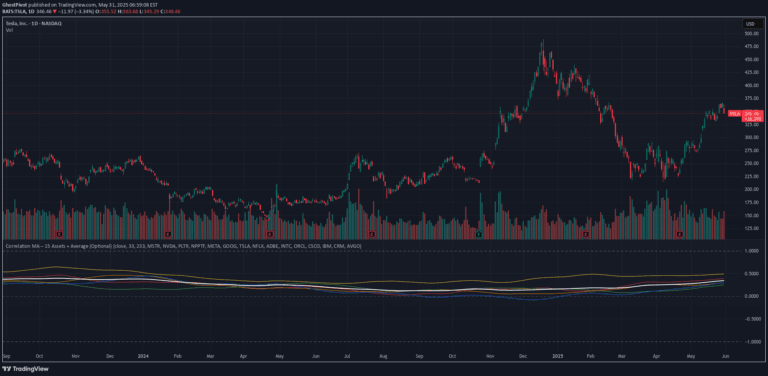
A technical indicator using James Hamilton's method to visually highlight US recession periods, providing macroeconomic context for trading decisions and economic analysis.
Explore complementary indicator rolesHow it works
The JHDUSRGDPBR indicator identifies and color-codes specific periods of economic recession in the United States using statistical and economic data analysis. It relies on comprehensive economic metrics like GDP, employment rates, industrial production, and other key economic indicators to determine recessionary periods.
By applying algorithmic analysis to these economic variables, the indicator generates visual representations that demarcate when the US economy experiences significant downturns. These color-coded areas help traders and analysts quickly recognize and understand broader economic cycles and potential market implications.
Why it may be useful
Understanding economic recession periods is crucial for traders and investors as these phases can significantly impact market performance and asset valuations. By providing a clear visual representation of economic downturns, the indicator helps market participants make more informed strategic decisions during challenging economic environments.
The JHDUSRGDPBR serves as a valuable macroeconomic context tool, allowing traders to correlate broader economic trends with potential market movements. It offers insights into systemic economic risks and can help investors adjust their portfolios and risk management strategies accordingly.
When to explore it
The JHDUSRGDPBR indicator is most effective when used as part of a comprehensive macroeconomic analysis framework alongside other economic indicators. It is particularly useful for long-term investors and swing traders who are interested in understanding broader economic cycles and their potential market impacts.
Traders should leverage this indicator during periods of economic uncertainty or when conducting historical market analysis. It provides valuable context for understanding how economic recessions correlate with market performance and can help inform strategic investment decisions across different asset classes.
Keep exploring
What we’ve verified
Access, alerts and repainting behaviour have not been independently verified for this indicator. Check the creator’s current publication and settings.
General descriptions and classifications are recovered research. Verified details above identify the specific checks we have completed. Check the creator’s current publication for later changes.