YOUR INDICATOR RESEARCH STARTS HERE

Find the right indicator.
Understand what it does.

Explore 11,183 indicators. Filter beyond the obvious.
Discover the tools that fit the way you trade.

THE INDICATOR LIBRARY

Explore the possibilities

11,183 tools to explore

21 indicators matching your filters
Save search
MomentumOscillatorTrend

Haydens RSI Trend Trader

by BarefootJoey

A trading companion indicator for Hayden's Advanced RSI that helps identify market trends and potential trading opportunities across different timeframes.

Separate pane · unverifiedScalping · Day Trading
Explore
1.8Klikes43.6Kviews33comments
Save
TrendMomentumEditor’s pick

Hurst Diamond Notation Pivots

by BarefootJoey

A Hurst-inspired pivot point indicator that marks cycle highs and lows using rainbow-colored lines and circles, helping traders forecast potential future market turning points.

Main price chart · unverifiedSwing Trading
Explore
1.4Klikes64.9Kviews84comments
Save
TrendMomentumEditor’s pick

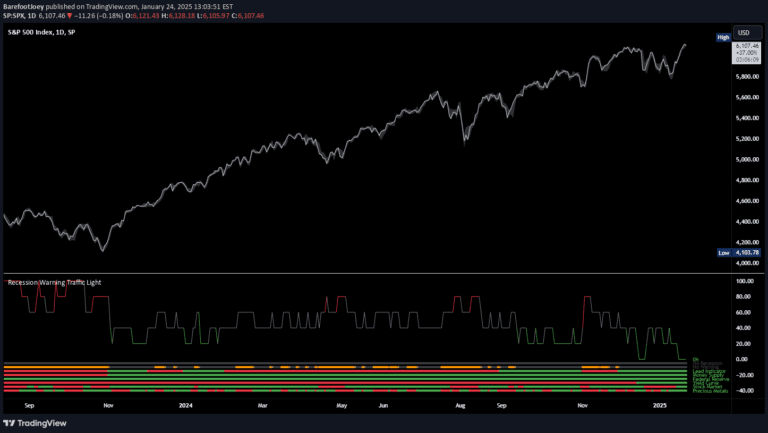
Recession Warning Traffic Light

by BarefootJoey

A multi-metric recession probability indicator using six key economic factors to assess potential economic downturns by analyzing various financial and market signals.

Separate pane · unverifiedSwing Trading
Explore
905likes35.6Kviews27comments
Save
LevelsSignalTrend

Astro: Planetary Channel Lines

by BarefootJoey

Planetary Channel Lines analyze stock market trends by mapping planetary positions as support and resistance lines, using astronomical data to predict potential market turning points.

Main price chart · unverifiedDay Trading · Swing Trading
Explore
627likes17.9Kviews40comments
Save
TrendMomentumEditor’s pick

The Investment Clock Orbital Graph

by BarefootJoey

The Investment Clock Orbital Graph is a macro trading tool that visualizes economic cycles by tracking GDP growth and CPI inflation rates across different market phases.

Separate pane · unverifiedDay Trading · Swing Trading
Explore
375likes20.4Kviews6comments
Save
OscillatorSignal

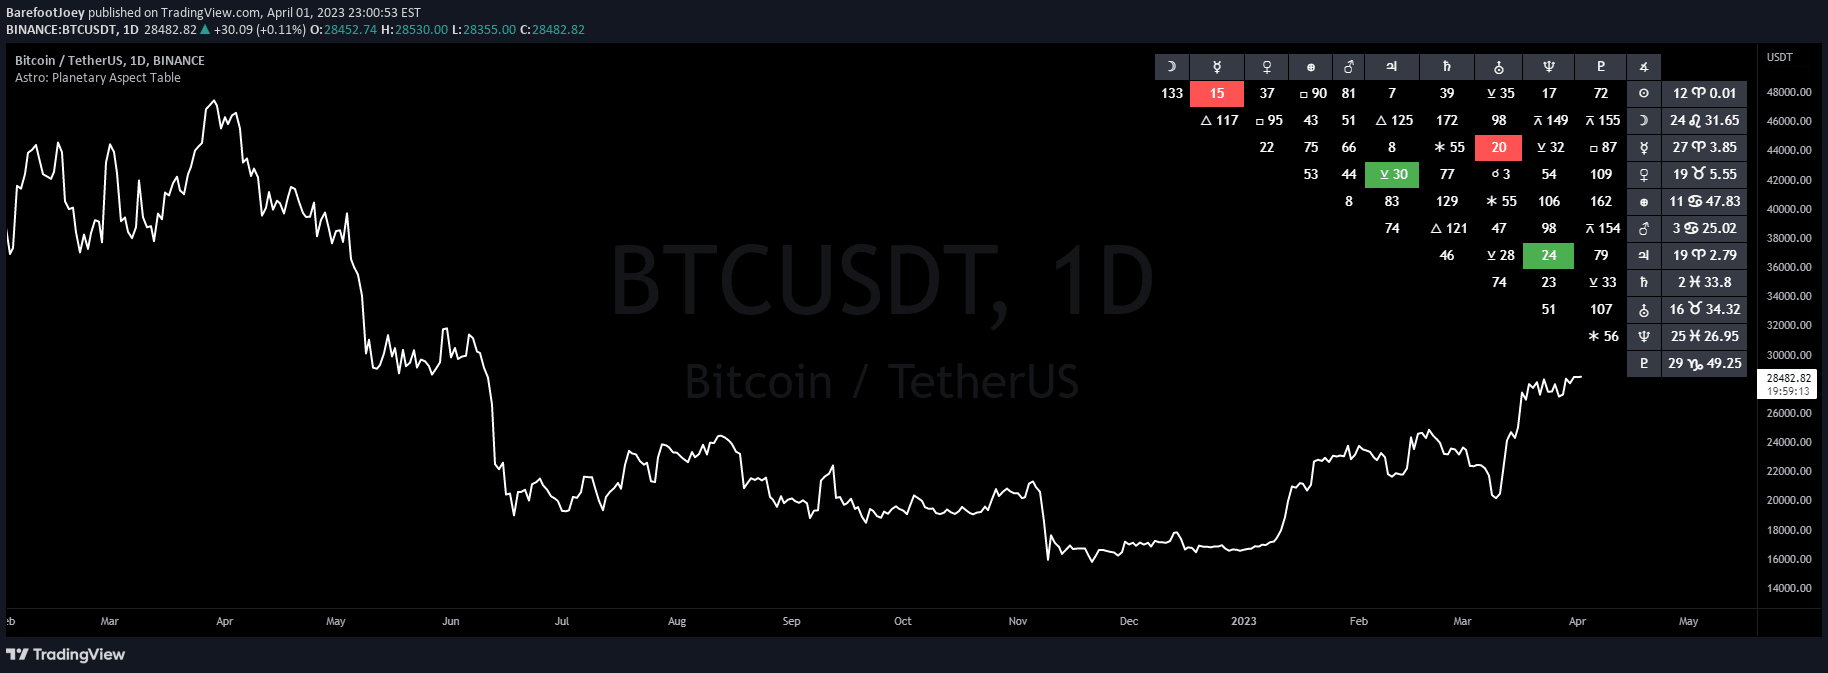
Astro: Planetary Aspect Dates

by BarefootJoey

A chart overlay that highlights planetary aspects in financial markets, tracking the angular relationships between celestial bodies and their potential trading influences.

Separate pane · unverifiedDay Trading · Swing Trading
Explore
361likes9.8Kviews24comments
Save
LevelsSignal

Astro: Celestial Coordinates

by BarefootJoey

A celestial coordinate tracking system that maps planetary positions and key turning points using astronomical measurements to provide insights into celestial object locations.

Separate pane · unverifiedSwing Trading
Explore
312likes8.1Kviews5comments
Save
OscillatorSignal

Astro: Planetary Aspects

by BarefootJoey

An astrological oscillator that measures planetary aspects by analyzing the angular relationships between planets, providing insights into potential market influences and energetic interactions.

Separate pane · unverifiedDay Trading · Swing Trading
Explore
182likes5.2Kviews5comments
Save
Signal

Astro: Planetary Speed

by BarefootJoey

Planetary speed explores how planets' orbital velocities can metaphorically represent market dynamics and trading energy, offering unique astrological insights into market movements.

Separate pane · unverifiedSwing Trading
Explore
179likes5.5Kviews1comments
Save
OscillatorSignalTrend

Dominant Cycle Detection Oscillator

by BarefootJoey

A multi-method dominant cycle detection oscillator that identifies market cycle lengths using various computational techniques to help traders understand and predict market rhythms.

Separate pane · unverifiedScalping · Day Trading
Explore
156likes5.4Kviews2comments
Save

Likes, views, and comments are historical TradingView snapshots. They describe attention, not trading performance.

START WITH A QUESTION

A little less searching.
A lot more understanding.

Tell DeepAlpha what you need. Get an explanation, a shortlist,
and a direct path to the indicators behind it.

Ask DeepAlpha