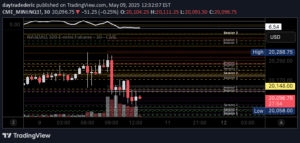
A Hurst-inspired pivot point indicator that marks cycle highs and lows using rainbow-colored lines and circles, helping traders forecast potential future market turning points.
Explore complementary indicator rolesHow it works
The indicator scans price data to identify pivot points by analyzing past market cycles and detecting significant high and low points. It uses a specific lookback period to determine these pivots, which are then marked with colored diamonds.
The system calculates the average length of previous pivot periods to help predict potential future cycle lengths. Once a pivot point is confirmed after the lookback period, it is plotted on the chart with a distinctive rainbow-colored line and circle
Why it may be useful
This indicator provides traders with a systematic approach to understanding market cycles and potential turning points. By visualizing historical pivot points, traders can gain insights into the rhythm and periodicity of price movements.
The rainbow color coding helps distinguish different cycle lengths and makes pattern recognition more intuitive. It offers a structured method for identifying potential trend reversals and understanding the underlying market dynamics
When to explore it
The pivot point indicator works best in markets with clear cyclical behavior and identifiable trending patterns. It is most effective in swing trading scenarios where traders aim to capture multi-day or multi-week price movements.
Traders should use this tool in conjunction with other technical analysis methods to confirm signals. It is particularly useful in markets with consistent trend structures, such as forex, commodities, and certain stock indices
Keep exploring
What we’ve verified
Access, alerts and repainting behaviour have not been independently verified for this indicator. Check the creator’s current publication and settings.
General descriptions and classifications are recovered research. Verified details above identify the specific checks we have completed. Check the creator’s current publication for later changes.