YOUR INDICATOR RESEARCH STARTS HERE

Find the right indicator.
Understand what it does.

Explore 11,183 indicators. Filter beyond the obvious.
Discover the tools that fit the way you trade.

THE INDICATOR LIBRARY

Results for “hurst”

11,183 tools to explore

19 indicators matching your filters
Save search
TrendMomentumEditor’s pick

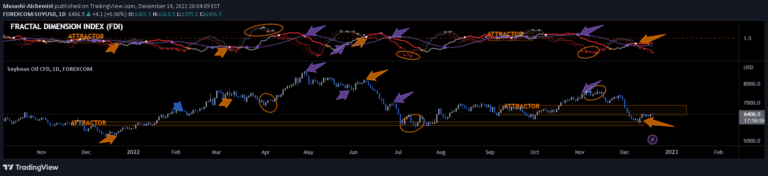
Musashi_Fractal_Dimension

by Musashi-Alchemist

Musashi Fractal Dimension Index (FDI) measures market behavior using fractal theory, revealing market persistence, trend potential, and price movement characteristics.

Separate pane · unverifiedDay Trading · Swing Trading
Explore
1.7Klikes55.6Kviews24comments
Save
TrendMomentumEditor’s pick

Hurst Diamond Notation Pivots

by BarefootJoey

A Hurst-inspired pivot point indicator that marks cycle highs and lows using rainbow-colored lines and circles, helping traders forecast potential future market turning points.

Main price chart · unverifiedSwing Trading
Explore
1.4Klikes64.9Kviews84comments
Save
TrendMomentumEditor’s pick

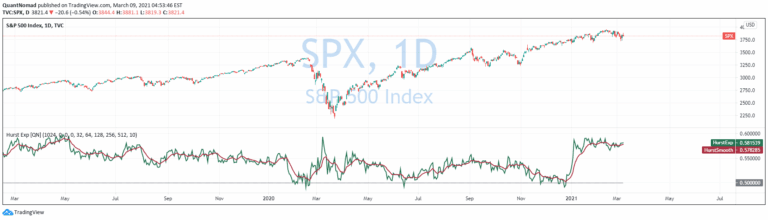
Hurst Exponent

by QuantNomad

The Hurst Exponent is a statistical measure that evaluates time series behavior, helping traders identify market trends, mean reversion, and potential future price movements.

Separate pane · unverifiedDay Trading · Swing Trading
Explore
861likes26.4Kviews10comments
Save
OscillatorSignalTrend

Cycle Indicator

by OmegaTools

A cycle analysis tool that helps traders identify market direction and predict potential future pivot lows by using a simplified version of Hurst theory's cycle tracking methodology.

Separate pane · unverifiedDay Trading · Swing Trading
Explore
244likes6Kviews4comments
Save
MomentumSignalTrend

Adaptive Fusion ADX Vortex

by simwai

An advanced trading indicator combining ADX, Vortex, and Hurst Exponent to identify trend strength, potential reversals, and filter market noise for more accurate trading signals.

Separate pane · unverifiedScalping · Day Trading
Explore
179likes5.9Kviews5comments
Save
OscillatorSignalTrend

Cycle Oscillator

by OmegaTools

The Cycle Oscillator is a market analysis tool that helps traders identify market cycles, track momentum, and forecast potential future price pivot lows using a simplified Hurst theory approach.

Separate pane · unverifiedScalping · Day Trading
Explore
172likes3.6Kviews2comments
Save
OscillatorSignalTrend

Harmonic Sine Waves model plot

by bartekhl

A signal generator creating complex sine wave patterns by combining base sine wave with its harmonics, demonstrating how simplified models can represent intricate market movements.

Separate pane · unverifiedScalping · Day Trading
Explore
159likes6Kviews7comments
Save
OscillatorSignalTrend

Dominant Cycle Detection Oscillator

by BarefootJoey

A multi-method dominant cycle detection oscillator that identifies market cycle lengths using various computational techniques to help traders understand and predict market rhythms.

Separate pane · unverifiedScalping · Day Trading
Explore
156likes5.4Kviews2comments
Save
LevelsPatternsTrend

SemiCircle Cycle Notation Pivots

by BarefootJoey

An advanced cycle analysis tool that automatically detects and visualizes market rhythm through semicircle waves, helping traders identify potential price pivot points and market cycles.

Main price chart · unverifiedScalping · Day Trading
Explore
115likes1.7Kviews1comments
Save
TrendSignal

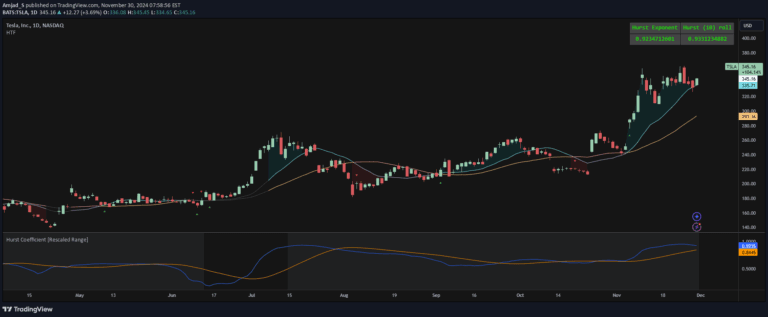
Hurst Exponent Trend filter

by Amjad_S

A trading indicator using the Hurst Exponent to categorize market states, identifying trending, random, and mean-reverting markets by analyzing time series auto-correlation.

Main price chart · unverifiedDay Trading · Swing Trading
Explore
113likes4.8Kviews7comments
Save

Likes, views, and comments are historical TradingView snapshots. They describe attention, not trading performance.

START WITH A QUESTION

A little less searching.
A lot more understanding.

Tell DeepAlpha what you need. Get an explanation, a shortlist,
and a direct path to the indicators behind it.

Ask DeepAlpha