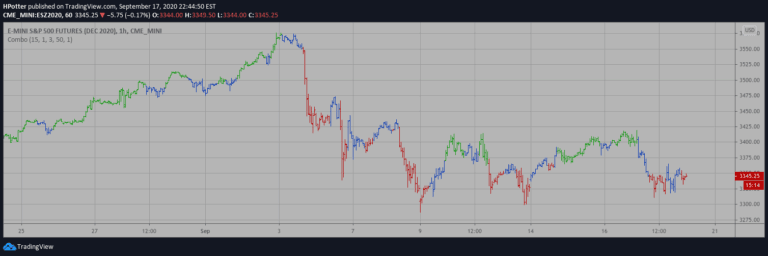
Musashi Fractal Dimension Index (FDI) measures market behavior using fractal theory, revealing market persistence, trend potential, and price movement characteristics.
Explore complementary indicator rolesHow it works
The Fractal Dimension Index calculates market behavior by determining the Hurst exponent, which reveals market persistence or anti-persistence. By subtracting the Hurst exponent from 2, the FDI provides insights into market dynamics.
Values between 1.0 and 1. 4 indicate trend continuation, while values between 1.6 and 2.0 suggest potential reversals. The indicator uses multiple FDI calculations with different periods to provide comprehensive market analysis
Why it may be useful
Traditional technical analysis often fails to capture market complexity, but the Fractal Dimension Index offers a more nuanced understanding of market behavior. By quantifying chaos and identifying hidden patterns, traders can better predict potential trend changes and market movements.
The indicator provides trend-agnostic information, helping traders make more informed decisions by revealing underlying market structure beyond linear measurements
When to explore it
The Fractal Dimension Index works best when analyzing markets with complex, non-linear behavior. It is particularly useful for identifying potential trend reversals, confirming momentum shifts, and understanding market volatility.
Traders should use FDI in conjunction with other technical indicators to validate signals. It is most effective in markets experiencing significant price fluctuations and when seeking to understand market dynamics beyond traditional linear analysis
Keep exploring
What we’ve verified
Access, alerts and repainting behaviour have not been independently verified for this indicator. Check the creator’s current publication and settings.
General descriptions and classifications are recovered research. Verified details above identify the specific checks we have completed. Check the creator’s current publication for later changes.