Musashi_Fractal_Dimension
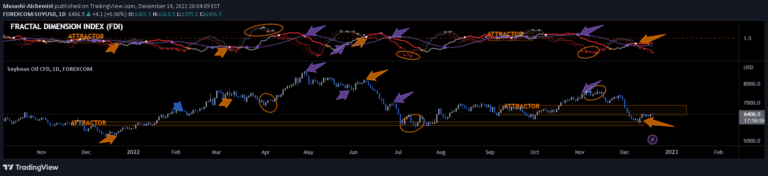
Musashi Fractal Dimension Index (FDI) measures market behavior using fractal theory, revealing market persistence, trend potential, and price movement characteristics.
Explore 11,183 indicators. Filter beyond the obvious.
Discover the tools that fit the way you trade.
11,183 tools to explore
Musashi Fractal Dimension Index (FDI) measures market behavior using fractal theory, revealing market persistence, trend potential, and price movement characteristics.
A Pine Script visualization technique that displays multiple moving averages in a 3D format using linefill.new(), allowing customizable MA types, lengths, and color schemes.
Equivolume bars create charts where bar width dynamically represents trading volume, providing visual insights into market activity independent of traditional time scales.
G-FRAMA is an adaptive trend-following indicator that uses Gaussian filtering and ATR bands to detect market trends while reducing noise and improving trade signal reliability.
An experimental approach to visualizing RSI performance by mapping its changes across time, creating a unique four-dimensional scatter graph that reveals underlying price and momentum patterns.
An advanced momentum indicator that combines RSI with Fractal Adaptive Moving Average (FRAMA) to create a more responsive and adaptive momentum oscillator with enhanced signal filtering.
A multi-dimensional Fibonacci tool that uses three points to create advanced projections, offering dynamic support and resistance analysis beyond traditional methods.
FRAMA is an adaptive moving average indicator that adjusts smoothing based on market volatility, generating trading signals by analyzing price position relative to the moving average line.
An adaptive Stochastic Oscillator that dynamically adjusts its lookback period based on market volatility, providing real-time divergence detection and ATR-based trailing stop signals.
A multi-dimensional market analysis tool that combines trend, momentum, price action, and market activity to generate comprehensive trading signals across different market conditions.
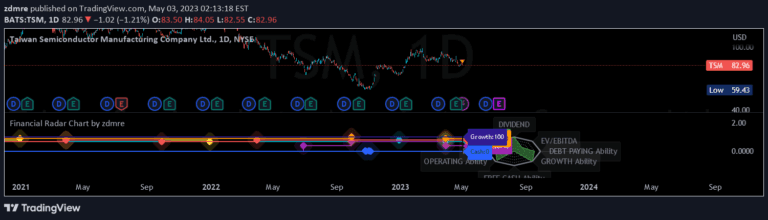
A comprehensive financial analysis radar chart that evaluates multiple key performance indicators to assess a company's financial health and investment potential.
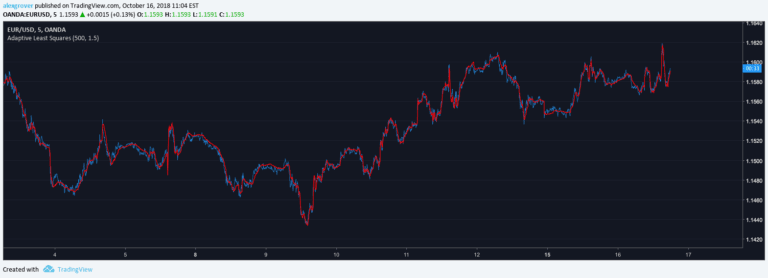
An adaptive filtering technique that dynamically adjusts its parameters based on market volatility, creating a responsive trend indicator that adapts to changing price movements.
Likes, views, and comments are historical TradingView snapshots. They describe attention, not trading performance.