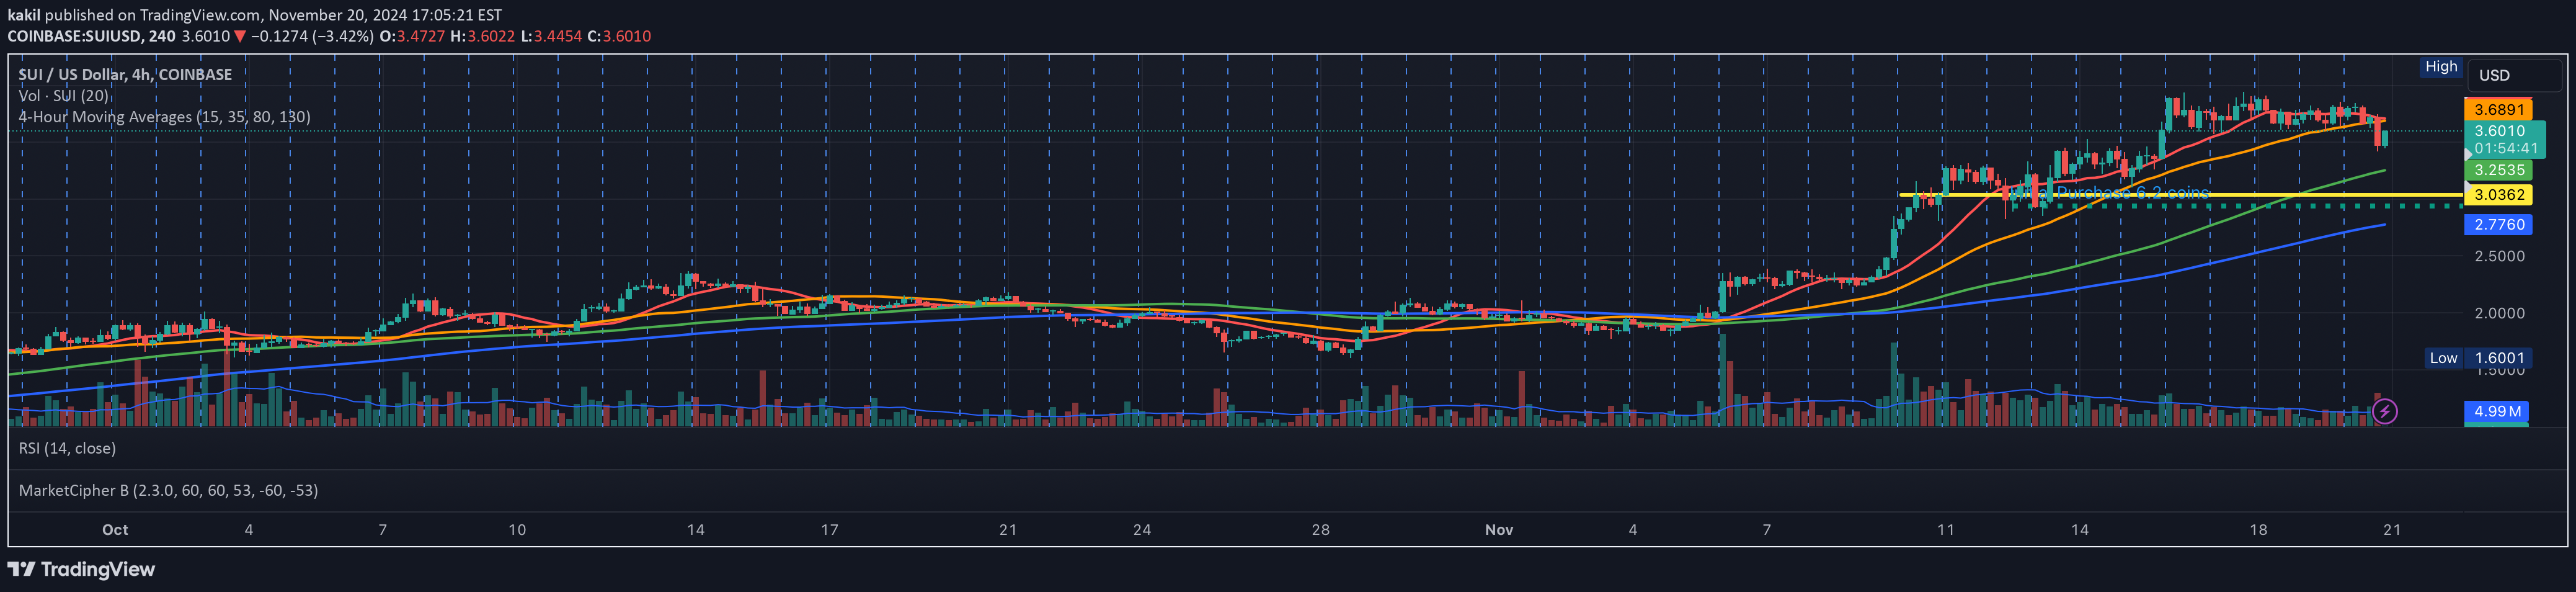
A Pine Script visualization technique that displays multiple moving averages in a 3D format using linefill.new(), allowing customizable MA types, lengths, and color schemes.
Explore complementary indicator rolesHow it works
This indicator generates multiple moving averages by starting with a base length and incrementing through a defined step. Users can choose between Simple (SMA) and Exponential (EMA) moving average types. The script calculates a series of moving averages with increasing lengths, creating a layered 3D visualization.
Each moving average is plotted with customizable colors and line widths, providing a comprehensive view of price trends. The technique allows traders to observe how different moving average lengths interact and trend simultaneously
Why it may be useful
This visualization method helps traders understand trend dynamics by displaying multiple moving averages concurrently. By showing different MA lengths and types, traders can gain deeper insights into price momentum and potential trend changes.
The color-coded and width-adjustable lines make trend analysis more intuitive and visually engaging. Multiple moving averages can confirm trend strength, identify potential trend reversals, and provide a more nuanced view of market behavior than single moving average indicators
When to explore it
This technique is most effective in markets with clear trending characteristics, such as forex, stocks, and cryptocurrencies. It works best during periods of sustained price movement, helping traders identify trend strength and potential reversal points.
Traders should use this method when seeking a comprehensive view of price trends across multiple timeframes. It is particularly useful for swing and day traders who need to quickly assess market momentum. The indicator can help confirm trend direction and filter out market noise
Keep exploring
What we’ve verified
Access, alerts and repainting behaviour have not been independently verified for this indicator. Check the creator’s current publication and settings.
General descriptions and classifications are recovered research. Verified details above identify the specific checks we have completed. Check the creator’s current publication for later changes.