Multi Time Frame Candles with Volume Info / 3D
A multi-timeframe candle visualization script that provides advanced trading insights, including volume information, remaining candle time, and breakout detection with customizable display options.
Explore 11,183 indicators. Filter beyond the obvious.
Discover the tools that fit the way you trade.
11,183 tools to explore
A multi-timeframe candle visualization script that provides advanced trading insights, including volume information, remaining candle time, and breakout detection with customizable display options.
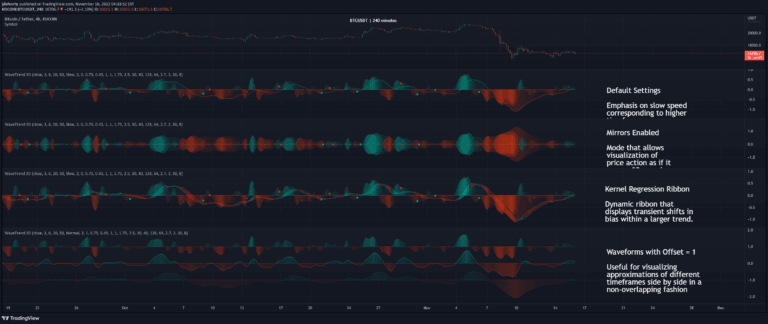
WaveTrend 3D is an advanced oscillator that uses digital signal processing and machine learning techniques to analyze price trends with enhanced precision and multi-timeframe support.
An advanced 3D astrological trading indicator that renders planetary movements, aspects, and zodiac positions to provide unique market insights based on celestial body interactions.
A trend-following indicator using multiple moving averages to analyze market direction and strength across different periods. Provides visual 3D representation of trend dynamics using configurable moving average types.
A Pine Script visualization technique that displays multiple moving averages in a 3D format using linefill.new(), allowing customizable MA types, lengths, and color schemes.
A compact 3-day lookback indicator that visually tracks price movement relative to previous day's high and low ranges using color-coded signals.
A multi-timeframe trend indicator using SMEMA that calculates market direction and strength across six timeframes, providing comprehensive trend analysis with adaptable weighting profiles.
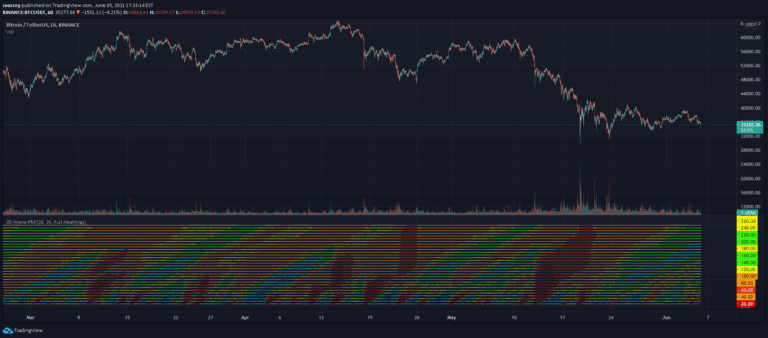
Wave-PM is a volatility oscillator that visualizes market energy cycles, revealing potential price movements through color-coded volatility phases and underlying market dynamics.
A sophisticated Pine Script indicator that renders 3D objects on trading charts, providing unique visualization of market trends through advanced geometric rendering techniques.
A specialized MACD indicator that uses high, low, and close prices to generate trend and momentum signals with color-coded visual representation of market movements.
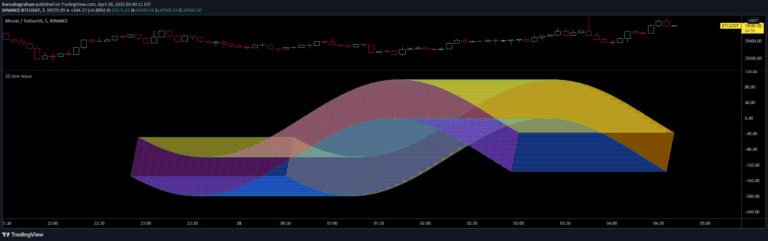
A unique 3D sine wave visualization that allows traders to create dynamic visual representations of market data by mapping inputs to a moving cube following a sine wave pattern.
A mathematical approach to creating complex 3D data structures and arrays in Pine Script, enabling advanced data processing and analysis for trading strategies.
Likes, views, and comments are historical TradingView snapshots. They describe attention, not trading performance.