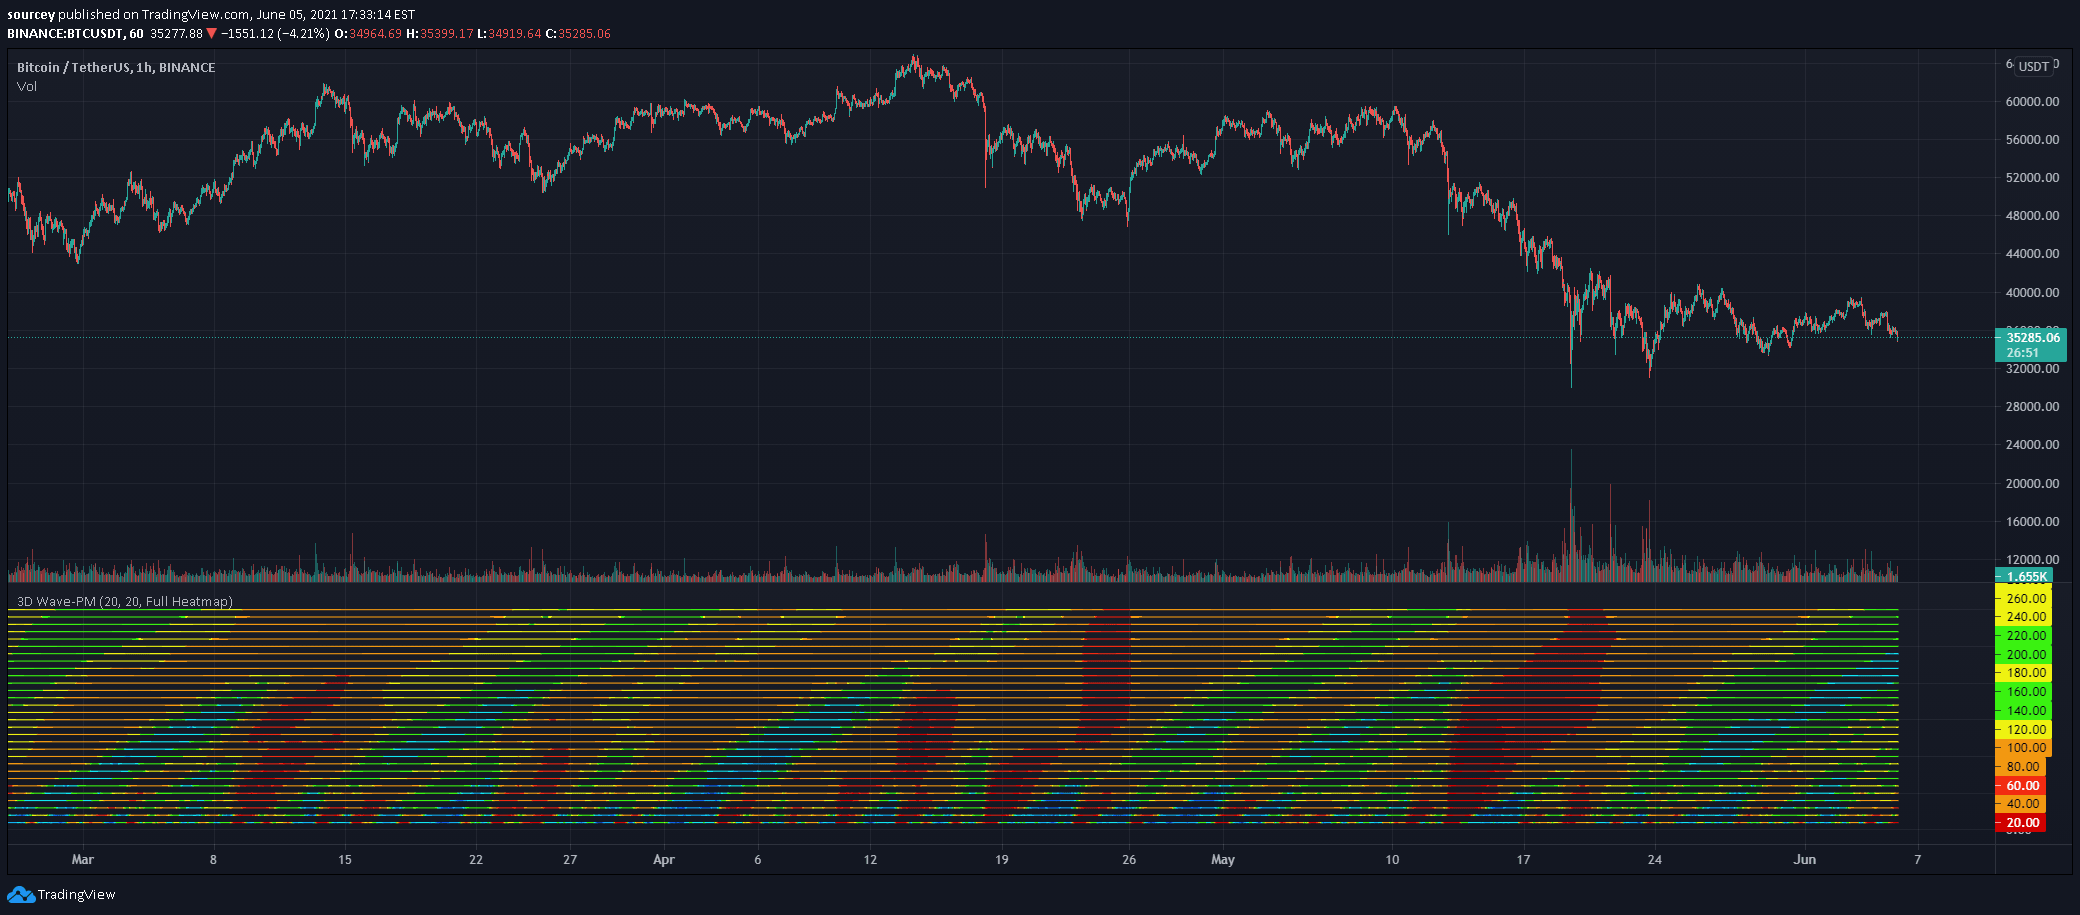
Wave-PM is a volatility oscillator that visualizes market energy cycles, revealing potential price movements through color-coded volatility phases and underlying market dynamics.
Explore complementary indicator rolesHow it works
Wave-PM analyzes market volatility by creating a heatmap of energy cycles using color-coded indicators. Blue and green plumes represent building market energy, while orange and red plumes signal potential significant price movements. The indicator processes multiple timeframes simultaneously, tracking underlying market dynamics.
It calculates volatility through complex algorithmic methods, mapping energy transitions and potential breakout points. The visualization helps traders understand cyclical market behavior beyond traditional price action. Mathematical models track subtle shifts in market momentum and potential energy buildup. Complex computational techniques enable precise volatility mapping across different market conditions
Why it may be useful
Wave-PM provides traders with a unique perspective on market volatility by revealing hidden energy cycles. It helps identify potential trend reversals and significant price movements before they occur. Traders can anticipate market shifts by understanding underlying energy dynamics.
The indicator offers insights beyond traditional technical analysis methods, revealing subtle market transitions. By visualizing volatility as a dynamic process, traders can make more informed decisions. The multi-timeframe approach allows for comprehensive market analysis. Complex computational techniques provide a deeper understanding of market psychology and potential price movements
When to explore it
Wave-PM works best during periods of market transition and potential trend reversals. It is particularly effective in markets with complex, non-linear price movements. Traders should use this indicator when seeking early signals of potential significant price shifts.
It provides maximum value in markets experiencing complex volatility cycles. The indicator is most reliable when combined with other technical analysis tools. Swing traders can benefit from its multi-timeframe analysis capabilities. Professional traders and algorithmic trading systems can leverage its comprehensive volatility mapping
Keep exploring
What we’ve verified
Access, alerts and repainting behaviour have not been independently verified for this indicator. Check the creator’s current publication and settings.
General descriptions and classifications are recovered research. Verified details above identify the specific checks we have completed. Check the creator’s current publication for later changes.