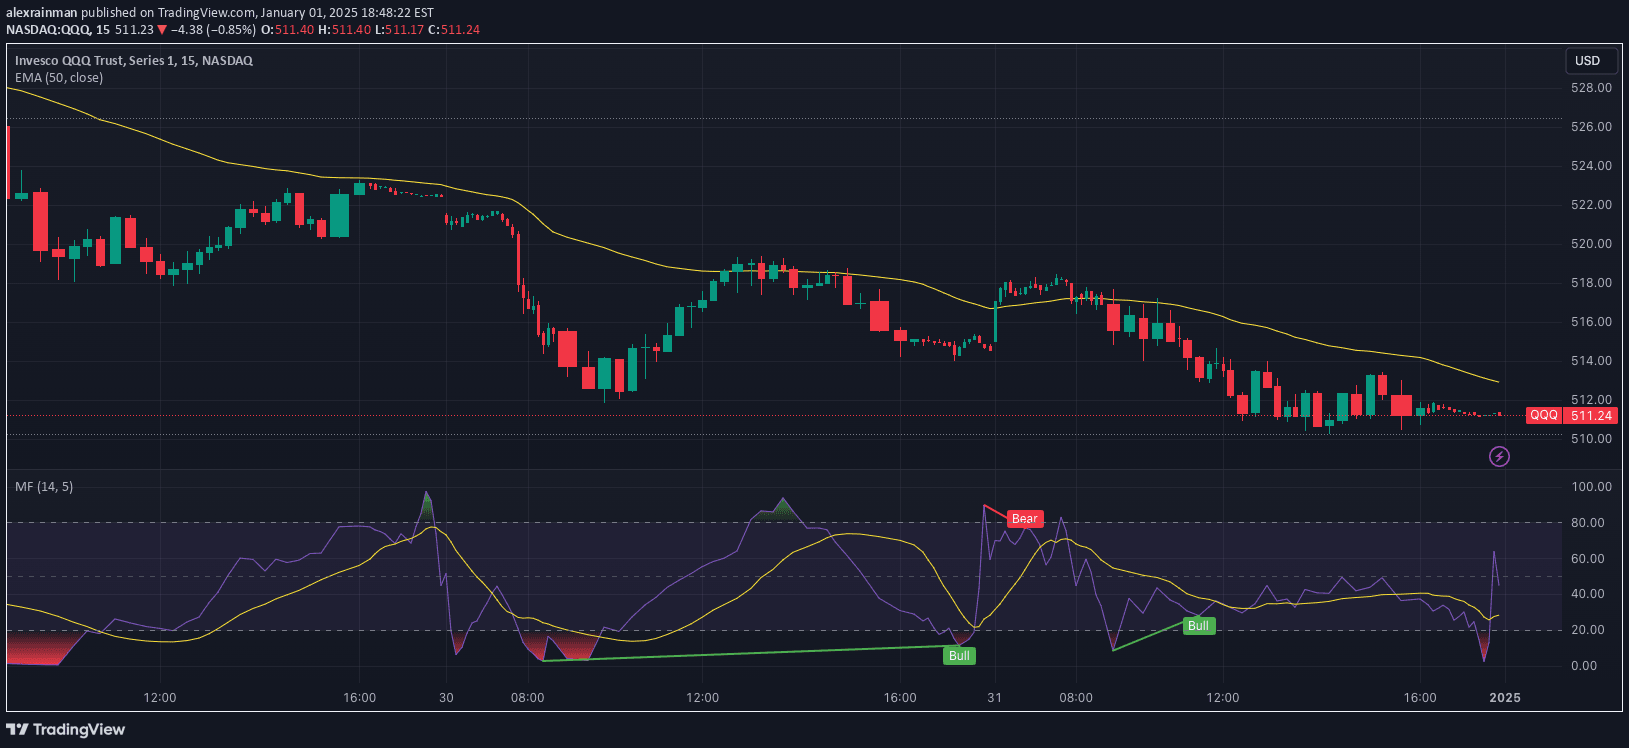
A specialized MACD indicator that uses high, low, and close prices to generate trend and momentum signals with color-coded visual representation of market movements.
Explore complementary indicator rolesHow it works
The Quantigenics MACD 3D calculates an average price from high, low, and close values, deriving a specialized MACD value that incorporates volatility through standard deviation and average calculations. By establishing upper and lower boundaries, the indicator generates a dynamic trend analysis that goes beyond traditional MACD methods.
The indicator uses color-coding to represent market trends: aqua indicates upward trends, red suggests downward trends, and yellow signifies potential reversal points. When the MACD value crosses above the upper boundary or falls below the lower boundary, momentum crossover signals are generated, providing traders with visual cues about potential market movements.
Why it may be useful
The MACD 3D offers traders a more comprehensive view of market trends by integrating multiple price dimensions and volatility considerations into a single, easy-to-interpret indicator. Its advanced methodology helps traders identify not just trend direction, but also potential momentum shifts and reversal points with greater precision than traditional indicators.
By providing color-coded signals and plotting standard signal arrows, the indicator simplifies complex market analysis, making it easier for traders to quickly assess market conditions and make informed trading decisions across different timeframes and market environments.
When to explore it
The MACD 3D is most effective in markets with clear trending characteristics, particularly in timeframes ranging from short-term scalping to longer-term swing trading scenarios. Its multi-dimensional approach makes it particularly useful in volatile markets where traditional indicators might provide less reliable signals.
Traders should consider using this indicator when seeking to confirm trend strength, identify potential reversals, and gain insight into market momentum across various financial instruments, including futures, forex, and indices. Its adaptability makes it valuable for both trend-following and countertrend trading strategies.
Keep exploring
What we’ve verified
Access, alerts and repainting behaviour have not been independently verified for this indicator. Check the creator’s current publication and settings.
General descriptions and classifications are recovered research. Verified details above identify the specific checks we have completed. Check the creator’s current publication for later changes.